WTI BULLS RUN INTO STRONG RESISTANCE ON THE FED, SUPPORTED AT 20-WMA
31 July 2019, 23:04
WTI bulls st back on a stronger Dollar following Fed cut, less dovish than expected outcome.
Bulls capped at 50-week moving average and Fibo resistance.
The price of oil dropped in the aftermath of the Federal Reserve event while the Greenback rallied to annual fresh highs on the 98 handle in the DXT meeting a high of 98.68. West Texas Intermediate crude touched a low of 57.90, down -0.50% on the session form a high of $58.79.
However, oil futures ended higher on Wednesday, with U.S. prices up a fifth consecutive session on the back of the government data showing that domestic crude inventories fell for a seventh consecutive week. The Energy Information Administration on Wednesday reported that U.S. crude supplies declined by 8.5 million barrels for the week ended July 26.
Meanwhile, the Federal Reserve threw a life-line for the Dollar and the main takeaway is that the Fed is watching for development on an economic front, both globally and domestically, mindful of soft US inflation running below target.
Federal Reserve outcome
The interest rate on excess reserves cut to 2.10% from 2.35%.
FOMC cuts benchmark rate by 25 basis points (bps); target range stands at 2.00% - 2.25%.
To conclude b/sheet reduction in august, 2-months earlier than previously indicated.
To roll over at auction all principal payments from holdings of treasury securities, reinvest all principal payments from agency debt and agency MBS received each month.
Principal payments from agency debt and agency mortgage-backed securities (MBS) up to $20 bln/month will be reinvested in treasury securities to roughly match maturity composition of outstanding Treasury securities.
Principal payments from agency debt and agency mortgage-backed securities in excess of $20 bln will continue to be reinvested in mortgage-backed securities.
Rate cut supports the committee's view that sustained economic expansion, strong labour market and near-target inflation. are most likely outcomes but uncertainties remain.
As it contemplates the future path of fed funds rate it will continue to monitor incoming info, act as appropriate to sustain expansion.
Household spending growth has picked up, but business fixed investment growth has been soft and inflation compensation measures remain low.
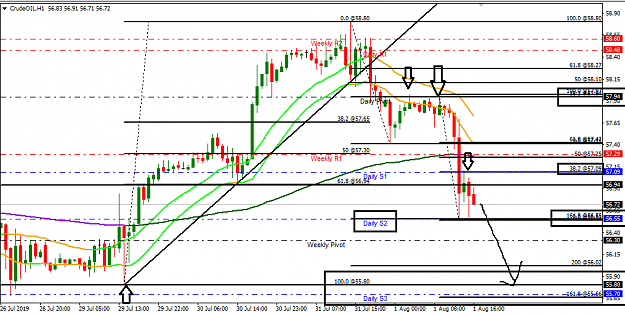
WTI levels
Technically, now supported at the 20-week moving average, the price took out the 200-day moving average earlier in the week and shot higher to pierce the 61.8% Fibo of the July swing highs and lows taking on the 58 handle momentarily, scoring as high as 58.79, meeting the 50-week moving average. On a continuation of the upside, oil can rally towards the 60 handle and double top in the 60.80s. On the downside, a break of 57.90 and the 50% Fibo opens the base of this wee's stick down at 55.84 and the rising support line of the channel. A break there opens 54.60, (a prior 61.8% Fibo.).
persistence and determination alone are omnipotent
Hello all, hope you are well, sorry I lost my vocals, been stuck in a checkmate situation of late but attained a default result, been looking in on the board and some great posts and some very nice little profits, respect
I've tried the systematic approach and to be very honest, failed miserably, and proud to say it, Sponge, your right, there's gold in them there hills,I should stick to being an opportunist.
WTI has taken me, it seems the news of past would have more impact than present, surprised we never seen -$50 by now, but worldwide events are still a buoyancy aid however, when the pin goes in, don't be left at the top.
My board is littered with broken pieces but my Queen is intact, it will stay that way for now, I owe this to Sponge and his stargazing, I held the Dow & NAZ for two days on the strength of change, and boy was Sponge right this breathed life back into the account, @ Sponge, keep looking up, and thank you, thanks for the words of wisdom and support, you know who you are.
I'm away for ten days tomorrow for work, couldn't go out on a better note, keep them moves tight everyone, good chess, D
I don't need to be good at the game, only good enough to beat my opponent,
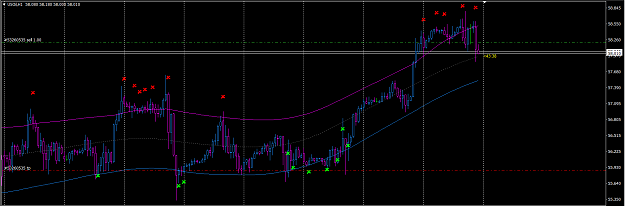
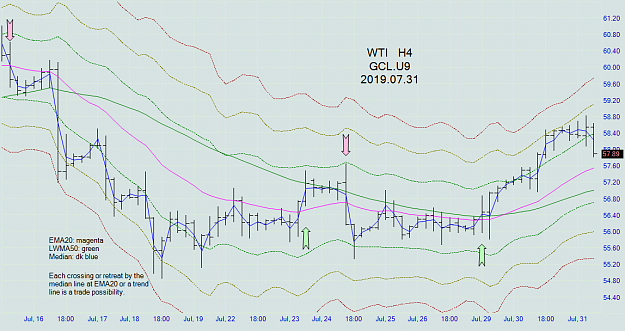
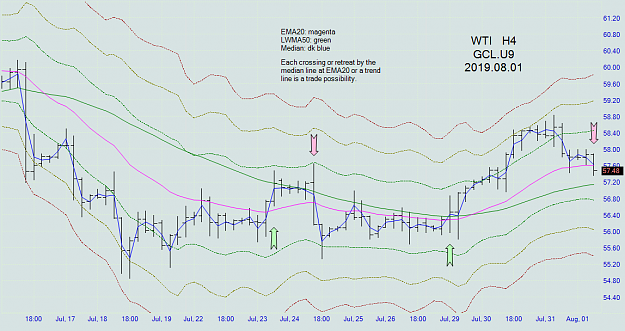
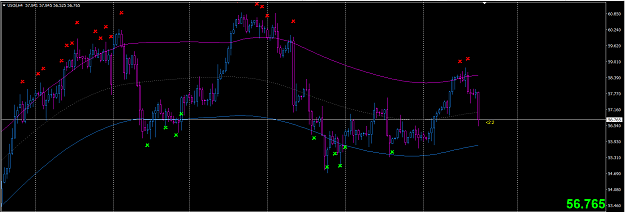
{quote} TC, always noticed the pattern on your chart, when the arrow appears the price advances then pulls back to the magenta then carries on, remarkable free services is this thread as I've often said, as always D
WTI H4 shows a reversal pattern between 58.4 and 58.8, above upper band 1 (UB1) which is often good shorting territory. EDIT BTW, the last green arrow pointed the way to 200+ pips. {image}
Ignored
D
I don't need to be good at the game, only good enough to beat my opponent,
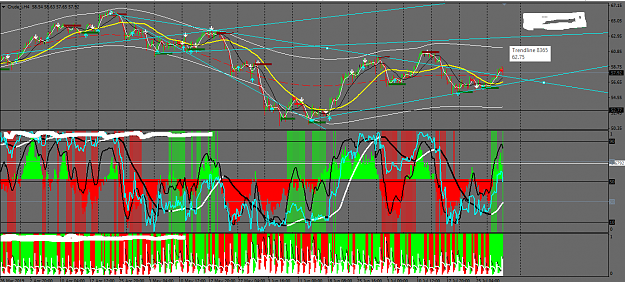
So the plot thickens, if it carries on in the same vein, 62.75, any thoughts, D
EDIT
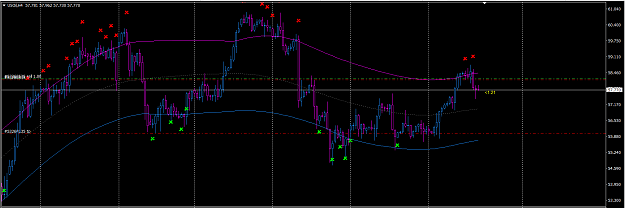
My only thought and you can just make it out, 3rd June the volume is on the masses side, something not apparent now, any comments??? thinner volume, rising price recipe for disasterD
Attached Image (click to enlarge)
I don't need to be good at the game, only good enough to beat my opponent,
Hello all, hope you are well, sorry I lost my vocals, been stuck in a checkmate situation of late but attained a default result, been looking in on the board and some great posts and some very nice little profits, respect I've tried the systematic approach and to be very honest, failed miserably, and proud to say it, Sponge, your right, there's gold in them there hills,I should stick to being an opportunist. WTI has taken me, it seems the news of past would have more impact than present, surprised we never...
Ignored
Thanks for the kind words D I'm glad it worked out for you
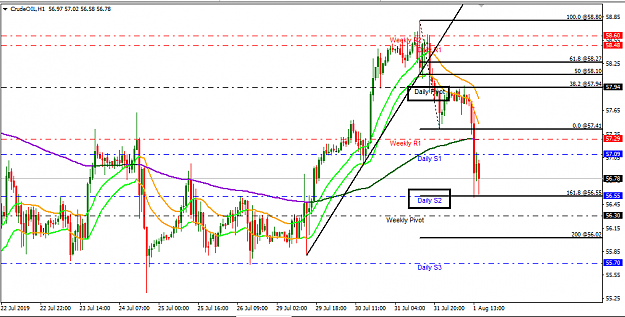
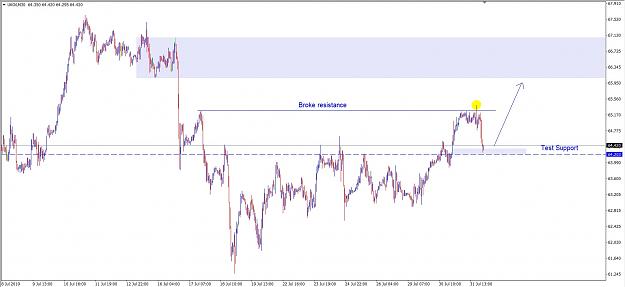
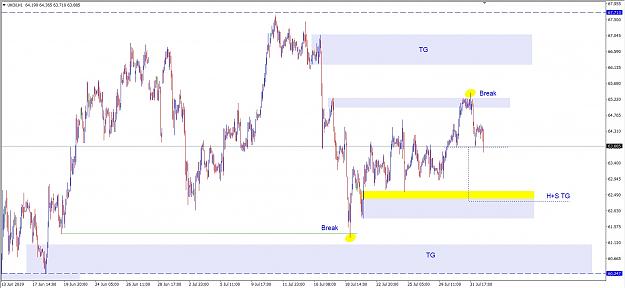
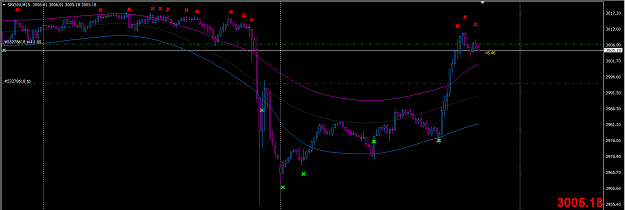
{quote} Trading at 63.96 at the moment, looking for support 63.72 now but more sideways/down below this level imo, near resistance 64.20 upside target 65xx a trend line break would taget 67.45 WTI following similar pattern with upside targ 60 however possible turn date Thurs 1st August, this one could be a continuation signal rather than a turn. Just my 2p Good luck {image}
Ignored
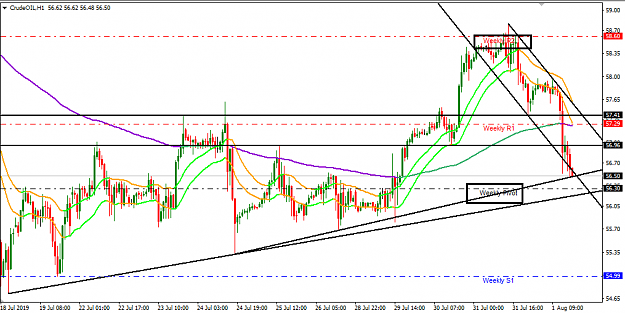
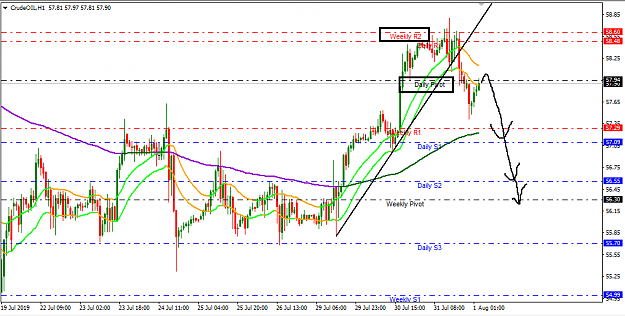
Turn date today 1st Aug, I had it as as possible continuation signal looking for 60 area but I think it needs to trade back over the daily pivot around 58.30 to stay bullish.