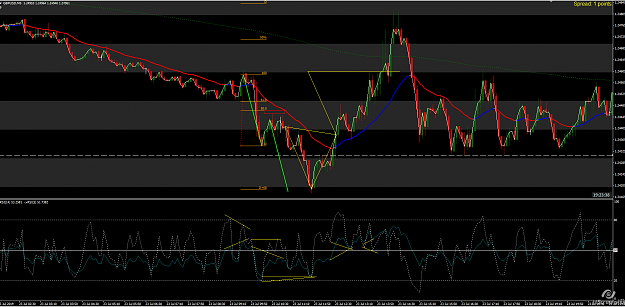
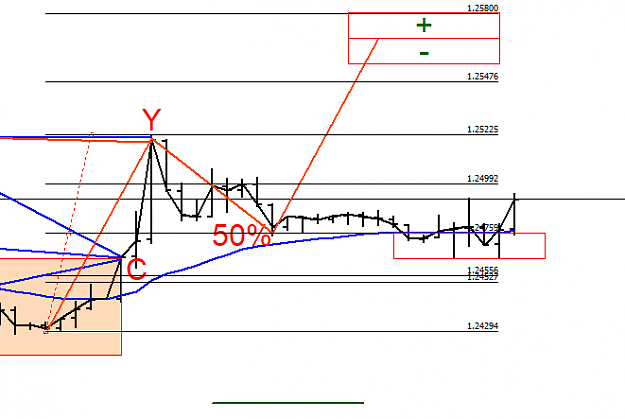
{quote} I think from what i see and read that there is an AB=CD pattern wich is a retracment of 50% +- a box... so u aim for that target... No Div need it in this scenario from what i remember from PDF {image}
Ignored
I think I can understand your statement, but back to what Alan said originally, At C or just after that point we have a short signal in the form of RSI div, seems like there is a form of div, but I don't think I see it, and I want to get it right
{quote} I think I can understand your statement, but back to what Alan said originally, At C or just after that point we have a short signal in the form of RSI div, seems like there is a form of div, but I don't think I see it, and I want to get it right
{quote} I think from what i see and read that there is an AB=CD pattern wich is a retracment of 50% +- a box... so u aim for that target... No Div need it in this scenario from what i remember from PDF {image}
Ignored
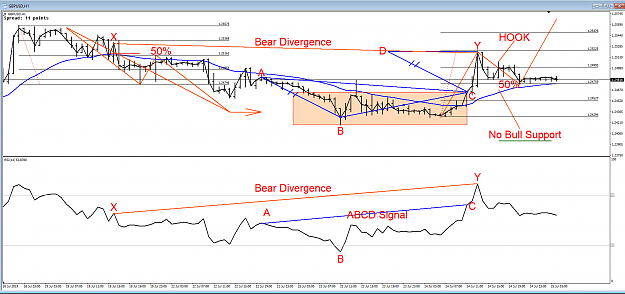
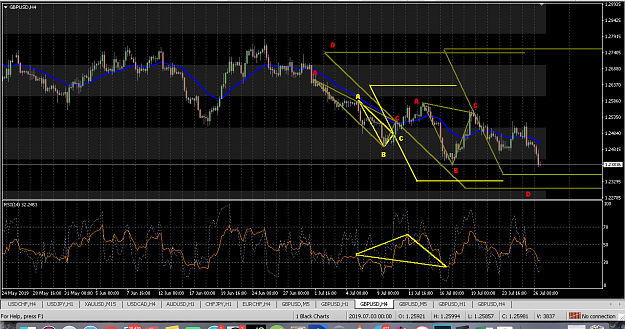
Plenty of signals on this chart. I have added in yellow.
I'm going out for the day and don't know when I will be back so here is a 1H chart for study.
You should be able to work out where the signals and targets are. The signals would all create ZOO points for trading considerations.
At the present this chart is in the process of forming an AB = CD and if it does break long then it will make the HH and drag the EMA to a swing HH also.
Note how I use the Quartile tool to find these AB = CD's.
If traded the entry is at the 50% with a stop at the 25% the target being 4 Quartiles making it a 1:4 risk/reward.
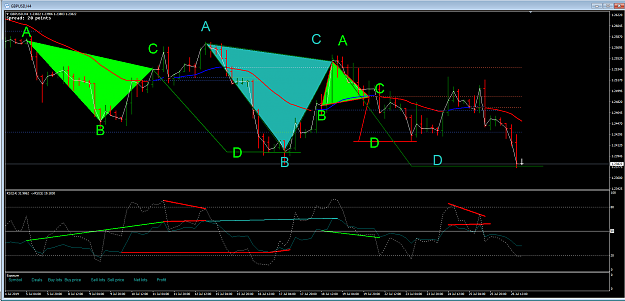
OK for those still struggling with the ABCD triangle.
Clearly you should be able to see when the price closed above the EMA it was higher than all those pivots in the shaded box so A is the next pivot we look at.
Drawing a line from A to C and then comparing this line with the line drawn on the RSI for the same points we have the conflict we are looking for. A is on the underside of the average but C is on the topside. I keep saying that C does not have to be a pivot.
Now the next time a similar thing happens with the red line X to Y at the target point of the ABCD. This is just a regular bearish divergence to attempt to take price back to the EMA, which it did.
If price can cross and find support then we have a downward situation. If it cannot find bear support then the chances are high that it will make the HH than the divergence. To plot just how high we can use the AB = CD to give us a target.
So we have two types of divs looking very similar except for the difference being the EMA, opposite sides = ABCD, same side = regular divergence.
{quote} Which post are you talking about with the C?
Ignored
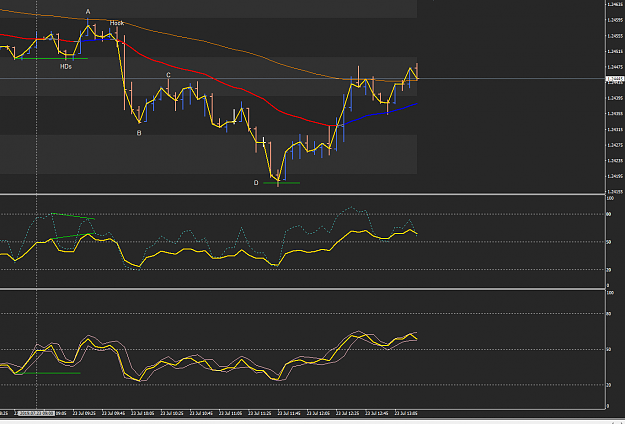
This C in here, and your original quote, and I struggle to see this RSI div, basically I don't know between which point I draw the line to reveal this div
At C or just after that point we have a short signal in the form of RSI div.
{quote} This C in here, and your original quote, and I struggle to see this RSI div, basically I don't know between which point I draw the line to reveal this div At C or just after that point we have a short signal in the form of RSI div. {image}
Ignored
Yep gotcha.
The C on his drawing was in the wrong place, it should be like this...
{quote} Now I see, thanks for the clarification. Sorry that if I seem to chase on this, just don't want to keep silence and pretend that I understand it if I actually don't.
Ignored
And that is the correct thing to do because I am shocking at reading minds.
Can anybody please take a look and tell me if these abcd patterns are drawn correctly on my chart. This is GBPUSD 4H chart. TIA {image}
Ignored
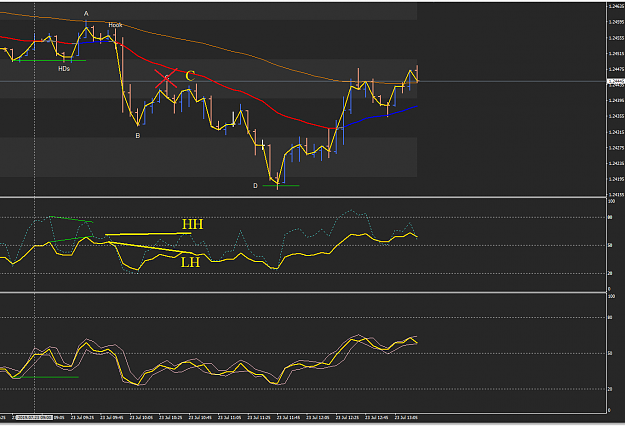
Because you are using candles and not bars and you do not have the 1 period SMA to show the pivots it is difficult to read your charts.
All I can do is show mine.
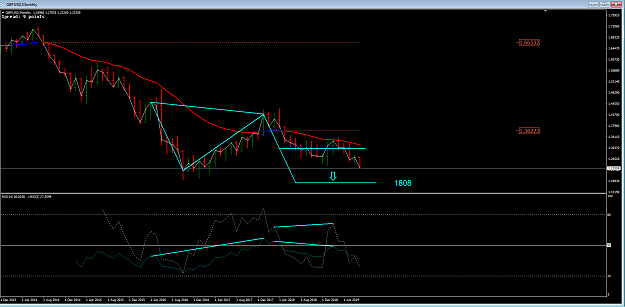
The blue ABCD drawn here is one I wouldn't have regarded as an ABCD because both pivots A and C were on the same side of the EMA so I would have just regarded it as divergence. However it does appear to have travelled all the way to the D target.
{quote} Because you are using candles and not bars and you do not have the 1 period SMA to show the pivots it is difficult to read your charts. All I can do is show mine. The blue ABCD drawn here is one I wouldn't have regarded as an ABCD because both pivots A and C were on the same side of the EMA so I would have just regarded it as divergence. However it does appear to have travelled all the way to the D target. {image}
Ignored
It's scary how accurate that pattern is... You could easily specialise in trading only ABCDs and do very nicely indeed.
{quote} It's scary how accurate that pattern is... You could easily specialise in trading only ABCDs and do very nicely indeed.
Ignored
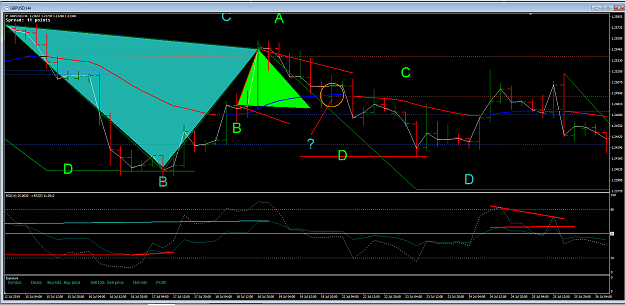
Alan, regarding the third (smallest) triangle, what exactly is the C point? It doesn't seem to be a pivot or the close of the bar, and I don't think there was a con div on the RSI at that point?
{quote} Alan, regarding the third (smallest) triangle, what exactly is the C point? It doesn't seem to be a pivot or the close of the bar, and I don't think there was a con div on the RSI at that point? Cheers
{quote} Alan, regarding the third (smallest) triangle, what exactly is the C point? It doesn't seem to be a pivot or the close of the bar, and I don't think there was a con div on the RSI at that point? Cheers
Ignored
I have just moved all the colours out of the way so we can see the bar more clearly. I can't remember this since it was a while back it could have been weekend gappage. I don't know what happened there.