How Do I know if I have a Strategy with Positive Skew?
You can do this visually without having to understand statistics. Positive skew means that your average winners are greater than your average losers and you are trading the right hand side of the Distribution of Returns to catch the fat tails (white swans).
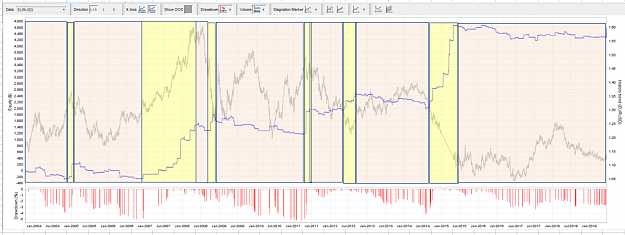
Have a look at the realised (blue) and unrealised (green) equity curve below produced with MT4 strategy tester.
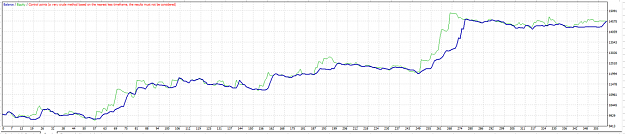
Notice how the green line (unrealised equity curve) sits in general above the realised equity curve. When it strays below the realised equity curve (blue) it hugs the realised curve closely. This is because we always cut losses short with this technique.
When sitting above the realised equity curve, it can significantly outperform. For example have a look at trades 249 to 274. This is when the EURUSD had a magnificent bear run in early 2015 and we took a ride with many shorts. Unfortunately we always need to give back some of this profit when the trend bends.
This visual clue with the realised and unrealised equity curve is symptomatic of divergent strategies of a trend following nature. With a trailing stop condition applied to your strategies, you will never exceed the unrealised equity curve. You always give back some profit to the market. This is the nature of trend following. However a trailing stop condition does assist in locking in most of the profit along the way in your unrealised equity curve.
With strategies of negative skew, you will find the reverse occurs. The Unrealised equity curve can sit well below the realised equity curve. This is a symptom that the strategy is warehousing risk and is likely to end in tears over the long term.
You can do this visually without having to understand statistics. Positive skew means that your average winners are greater than your average losers and you are trading the right hand side of the Distribution of Returns to catch the fat tails (white swans).
Have a look at the realised (blue) and unrealised (green) equity curve below produced with MT4 strategy tester.
Attached Image (click to enlarge)
Notice how the green line (unrealised equity curve) sits in general above the realised equity curve. When it strays below the realised equity curve (blue) it hugs the realised curve closely. This is because we always cut losses short with this technique.
When sitting above the realised equity curve, it can significantly outperform. For example have a look at trades 249 to 274. This is when the EURUSD had a magnificent bear run in early 2015 and we took a ride with many shorts. Unfortunately we always need to give back some of this profit when the trend bends.
This visual clue with the realised and unrealised equity curve is symptomatic of divergent strategies of a trend following nature. With a trailing stop condition applied to your strategies, you will never exceed the unrealised equity curve. You always give back some profit to the market. This is the nature of trend following. However a trailing stop condition does assist in locking in most of the profit along the way in your unrealised equity curve.
With strategies of negative skew, you will find the reverse occurs. The Unrealised equity curve can sit well below the realised equity curve. This is a symptom that the strategy is warehousing risk and is likely to end in tears over the long term.
6