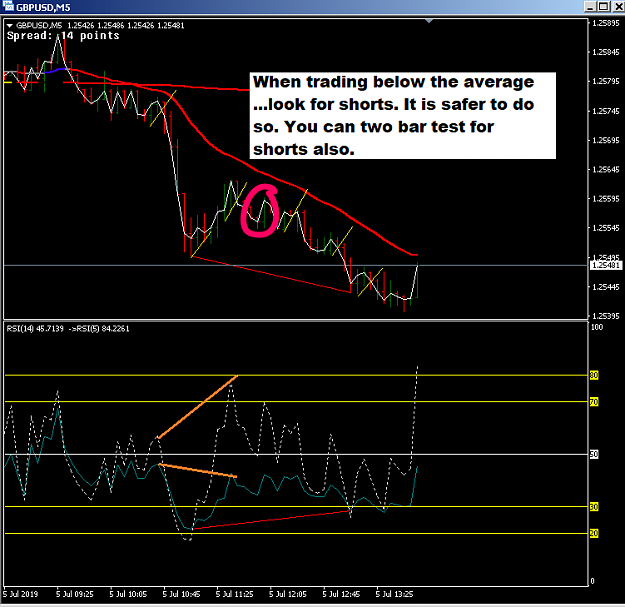
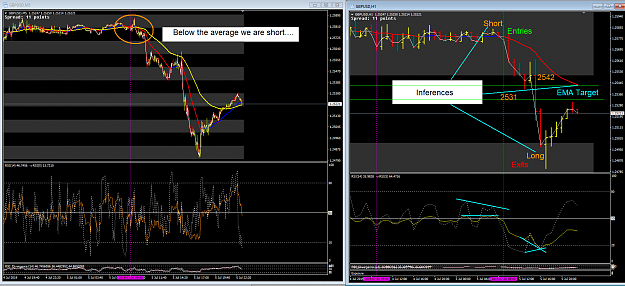
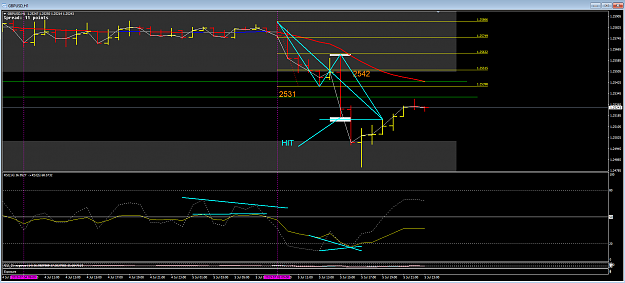
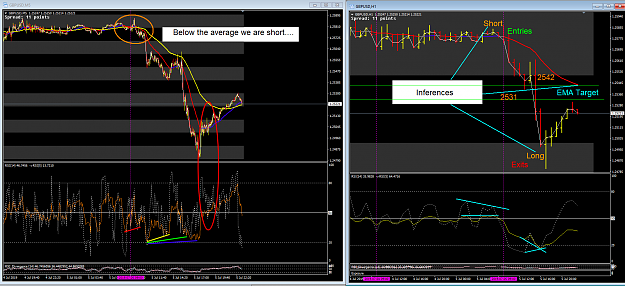
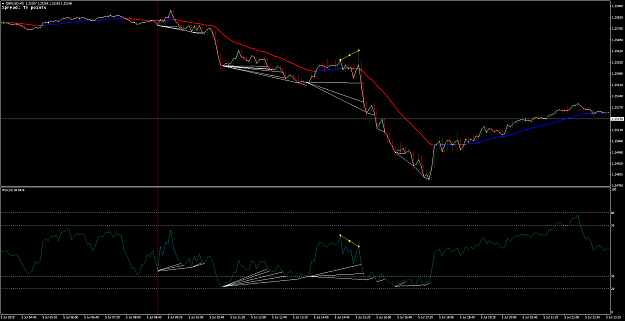
DislikedAlan At the time of trading, would you consider this as two bar test btw? I entered in the green bar in the circle as the previous bar close above the bottom, also taking the inference from H1, but obviously it failed. {image}Ignored
Attached Image (click to enlarge)