{quote} @skyway -- I'm not sure what you are trying to highlight. But it looks to me like the BD strategy continues to do the right thing.
Ignored
When price poke at BD lines, the liquidity gap, Nih SweetSpot give us the idea where those "targets" lie - they compliment each other very well with BD giving us a sense of where price is at the moment.
I like, impress this method with gold trading. big profit. However the risk of risk is also great! If Transactions favor the trend for higher profits.
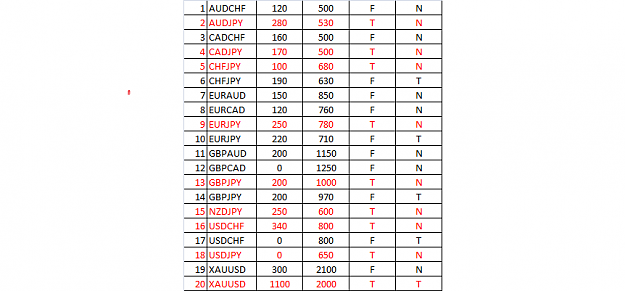
I have statistics of transactions according to R4M method BD ADR, the results are in the attached table
Note: 1. number of pairs 2. pair of transactions 3. Price poked through ADR BD 4. ADR BD distance with center line 5. The profit result is (T), not achieved (F) compared to the center line 6. Trading with the same trend (T), counter trend (N)
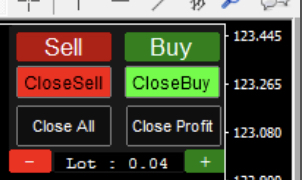
Does anyone have a tool for placing orders. {image} - place market orders & pending orders - close orders, delete pending orders - draw a hidden TP/SL line on chart - use magic number - etc Pls share if you have.
Ignored
@bishopdotun -- I agree this is a better way to go than the proxy EA I was using. I'm removing support for the proxy EA in the next version.
{quote} R4m detective looks like fractals. In my experience, fractals can help eyeball trendlines or zones, but that's not really what they are for. Bill Williams trading coined their use for reversals and breakouts to the opposite side. If we want to use targets or bounce points, honing the liquidity gaps indicator would be a good move. Sam seiden has a lot of stuff on that on youtube. Even if someone doesn't trade that way.. being able to spot them on a chart will make your trading better. I love the liquidity gaps indicator. Anything that spots...
Ignored
@JaxPacific
hope this will answer , at least partly, to your question about the division by 8 - nothing mystic.
a) Price shows most of the time parabolic moves on all time frames
b) Fibonacci serie graphically represented is parabolic
c) at the time of Gann it existed no computer, the division by 8 of a Price Range is a good approximation of the Fibonacci serie, then of Price Action parabolic moves
Moreover "the proof is in the pudding" . Division by 8 of the Price Range works efficiently on ALL Timeframes and all financial entities Indexes, Forex pairs, shares etc
{quote} "...... speak your piece once and go. " That's exactly what i did, if only you bothered to read before jumping to conclusions and quoting me-. On the contrary, you have reinforced my point. Anyway, please carry on- I am letting things be. So good luck. Thanks
Ignored
Dude, just go(edited) from here. I don't know why OP don't ban you. You just Keep coming and search for attention. Go and take care of your MASTER!
{quote} @JaxPacific hope this will answer , at least partly your question about the division by 8 - nothing mystic. a) Price shows most of the time parabolic moves on all time frames b) Fibonacci serie graphically represented is parabolic c) at the time of Gann it existed no computer, the division by 8 of a Price Range is a good approximation of the Fibonacci serie, then of Price Action parabolic moves {file}
Ignored
Ahh I see.. Hence the time/price relationship. You would need to graphically find a limit to avoid a constant fractal parabolic move.. so graphing a high low harmonic and using fibonacci..which is basically an ever-increasing parabolic move, shows a close approximation of the time price relationship within limits? huh. Yeah, I guess that makes sense.
Last (2 part) question. How often would you need to recalculate in order to keep up with market changes, and would you need to adjust your upper and lower fractal/octave as volatility changes to find the best relationship?
Shoot. Sorry.. I should probably check out the thing you sent me. It clicked as soon as I read your answer.. but I hate it when people do that to me and ask questions about the thing they haven't read yet. lol Thanks again!
What I like about it.. is.. rather than an actual daily atr.. it seems like it could be more of an atr that the market sets for itself based on time and price.. almost like measuring the breath? Interesting.
{quote} Dude, just Fuck Of from here. I don't know why OP don't ban you. You just Keep coming and Steel for
Ignored
@majamivice -- either delete your post or clean up the language. Also, consider that @aaven may not be a male. And if that is the case, you should never talk to a female that way.
EDIT: I understand that is your way of supporting me and this thread -- and I appreciate it. And I can handle any intruders.
{quote} Ahh I see.. Hence the time/price relationship. You would need to graphically find a limit to avoid a constant fractal parabolic move.. so graphing a high low harmonic and using fibonacci..which is basically an ever-increasing parabolic move, shows a close approximation of the time price relationship within limits? huh. Yeah, I guess that makes sense. Last (2 part) question. How often would you need to recalculate in order to keep up with market changes, and would you need to adjust your upper and lower fractal/octave as volatility changes...
Ignored
very simple as much it is necessary.
a) the division by 8 of a Price Range defines the Gann Octave of this Price Range for ALL Financial Entity fluctuating within this Price Range
b) hence Price Action fluctuations of this Financial Entity is very sensible to this "vibration" and its subdivision by 2
c) when a financial entity is sensible to a specific "vibration" , it can tolerate 25 % deviation above or under the Price Range Limits
d) these deviation of 25 % represents the Phase of Transition structurally existing between 2 adjacent Fractal Price Range.
e) if Price Action fluctuates within the 25 % Phase of Transition Zone ABOVE the Price Range, it means that Price Action does not "know" yet (and you too) if Price Action will stay in the present Price Range or go higher.
f) When Price Action goes HIGHER than Price Range Limits + 25 %, then you have to DOUBLE the Price Range used, then the Gann Octave, then the Vibration used
g) When Price Action goes LOWER than Price Range Limits +25 %, then you have to HALVE the Price Range used, then the Gann Octave, then the Vibration used
This is valuable in all conditions ....... and easily codable !
{quote} very simple as much it is necessary. a) the division by 8 of a Price Range defines the Gann Octave of this Price Range for ALL Financial Entity fluctuating within this Price Range b) hence Price Action fluctuations of this Financial Entity is very sensible to this "vibration" and its subdivision by 2 c) when a financial entity is sensible to a specific "vibration" , it can tolerate 25 % deviation above or under the Price Range Limits d) these deviation of 25 % represents the Phase of Transition structurally existing between 2 adjacent Fractal...
{quote} @majamivice -- either delete your post or clean up the language. Also, consider that @aaven may not be a male. And if that is the case, you should never talk to a female that way. EDIT: I understand that is your way of supporting me and this thread -- and I appreciate it. And I can handle any intruders.
Ignored
Understood. We should Never talk like this to women!
There's a new update available of the BD indicator. You can download it from the other thread "Custom Indicators for TMA-ADR Reversal Trading and BBMA" (https://www.forexfactory.com/showthread.php?t=920925).
This version differs from the previous in the following ways:
1. I think BUY | SELL | EXIT alerts should all be working. I'm 90% sure that BUY | SELL alerts are working, but I couldn't confirm that EXIT alerts are. Positive or negative feedback would be appreciated.
2. I've removed support for TradeManagerEA -- the proxy EA I described previously.
3. A few cosmetic changes.
Overall, I think this is a good milestone for the indicator. I think I have the logic and rules implemented as @bishopdotun had originally described. At this point I would request that people just test the heck out of it and report bugs or unexpected behavior. Also, screen shots that display a false positive signal are most helpful.
Assuming the indicator is working correctly and generating the correct signals then I can adapt it to execute as an EA. Perhaps I'll have something available within the next day so people have a day or so to test it before the coming weekend. Since the performance issue seems to have been resolved, then each symbol / TF you wish to trade would be attached to it's own chart.
Performance could still be an issue, so I would recommend the following:
1. Do NOT use templates with the EA. Unbeknownst to you templates may pull in other graphical objects that increase the size and load time of the template and its *.tpl file. We want the EA to be lean-and-mean and execute alone in it's own chart.
2. Do NOT add other indicators to the same chart the EA is running in. MT4's architecture is single-threaded -- meaning, each chart runs in a single thread of execution and is alotted a time slice of the CPU. The computations of all indicators attached to a chart count against this time slice. If the time slice ends before all computations have completed then tough sh-t -- MT4 gives the CPU to the next chart. The chart waits its turn and eventually it will get a new time slice to complete the previous computations and start new ones. If computations take longer than the alotted time slice then MT4 becomes noticeably sluggish.
3. If you are going to trade multiple pairs, then I would recommend launching a separate session of MT4 whose only charts are running the EA. Everyone is aware it's really simple to run multiple sessions of MT4, right? But, if not, then Google how to do it.
Joined Mar 2007
|
Status: One life - live it...
|717 Posts
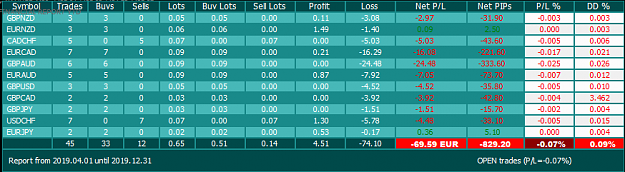
Open trades ATM..
Drawdown part of the game.... no pain no gain!
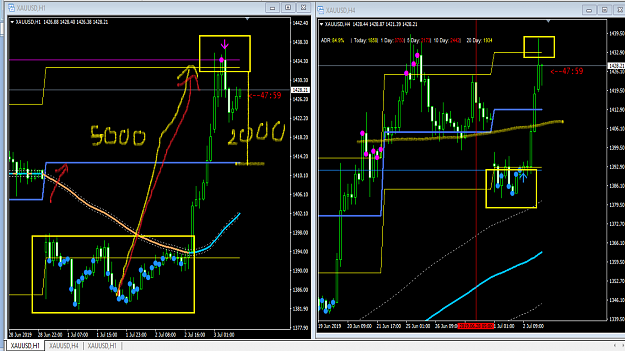
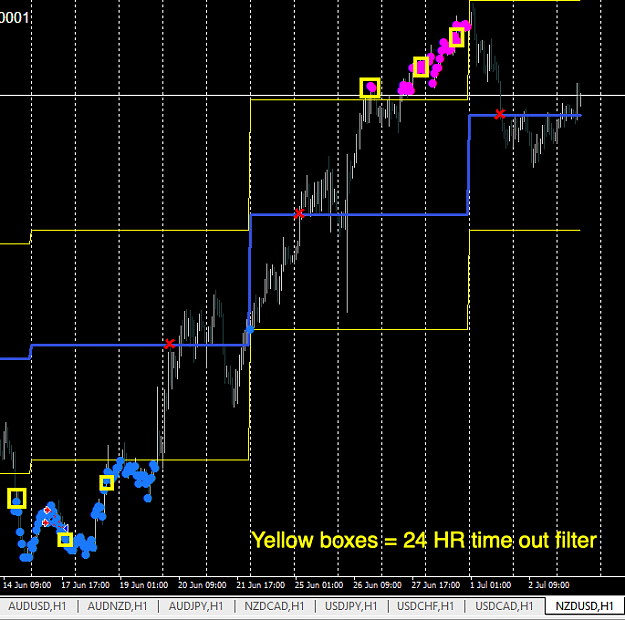
@R4M - thanks for the update..... would love the time-out filter in next update, so we only get X amount of alert on the same pair/signal - ie only a signal every 24 hr...see image.
Open trades ATM.. Drawdown part of the game.... no pain no gain! @R4M - thanks for the update..... would love the time-out filter in next update, so we only get X amount of alert on the same pair/signal. Cheers PC {image}
Ignored
Quote
Disliked
would love the time-out filter in next update, so we only get X amount of alert on the same pair/signal
@pipcruiser -- so, you're getting multiple alerts? Are you switching pairs or time frames on the same chart? When the indicator is attached to a chart and left alone does it still give multiple alerts when a signal appears?
EDIT: From your screen shot I think the correct behavior is one alert per bar. I don't think alerts should be grouped -- that's too unintuitive. Also, why once every 24 hours? Why not once every 12 hours? Or 48 hours? If alerts are annoying, I'd rather put a button on the chart that makes it easy to toggle alerts ON / OFF.
EDIT: Another idea -- disable them after the first alert. And then it is up to you to re-enable them when you are ready. And there could be a button on the chart that makes it easy to toggle alerts ON / OFF.
Open trades ATM.. Drawdown part of the game.... no pain no gain! @R4M - thanks for the update..... would love the time-out filter in next update, so we only get X amount of alert on the same pair/signal - ie only a signal every 24 hr...see image. Cheers PC {image} {image}
Ignored
Did you enter USDCHF late? I'm also into DD on most pairs except for USDCHF, that one is in good profit for now.
Do you have rules for adding to trades? I.e. basket trading? Like, add to the position after x% of ADR when trade goes against you?
{quote} Did you enter USDCHF late? I'm also into DD on my pairs except for USDCHF, that one is in good profit for now. Do you have rules for adding to trades? I.e. basket trading? Like, add to the position after x% of ADR when trade goes against you?
Ignored
@LongBTC, @pipcruiser -- I'd recommend not worrying about individual trades. Wait until you have about 100 trades under your built and then we'll look at the statistics.
@LongBTC -- I'm guessing you are slender and have never been on a diet, but when people go on a diet the worst thing they can do is weigh themselves every 30 minutes. It just doesn't work. @George et al spend a lot of time waiting for setups and baby-sitting every trade -- we want to get away from that. If we have confidence in the strategy then we just trade it with the understanding there will be ups and downs, but mostly ups.
{quote} {quote} @pipcruiser -- so, you're getting multiple alerts? Are you switching pairs or time frames on the same chart? When the indicator is attached to a chart and left alone does it still give multiple alerts when a signal appears? EDIT: From your screen shot I think the correct behavior is one alert per bar. I don't think alerts should be grouped -- that's too unintuitive. Also, why once every 24 hours? Why not once every 12 hours? Or 48 hours? If alerts are annoying, I'd rather put a button on the chart that makes it easy to toggle alerts...
Ignored
_____
Yes I get "the same" alert on same pair several times, annoying when Im already in the trade from the first signal, image on 28 charts - a lot of alert spam haha.
{quote} _____ Yes I get "the same" alert on same pair several times, annoying when Im already in the trade from the first signal, image on 28 charts - a lot of alert spam haha. Why 24 - why not? PC
Ignored
Moving forward will the additional alerts be for new grid trades should other filters be met?
Some people say I'm lucky, but the more I practice the luckier I get
{quote} Did you enter USDCHF late? I'm also into DD on most pairs except for USDCHF, that one is in good profit for now. Do you have rules for adding to trades? I.e. basket trading? Like, add to the position after x% of ADR when trade goes against you?