{quote} Hi Bro @Anrod, You can't test MTF indi with MT4 Strategy Tester. Regards NIH
Ignored
Hi Nih98
Thanks for your reply. Oh well that explains a lot to me. Had this issue with some other indicators as well. I'll have to visually backtest then
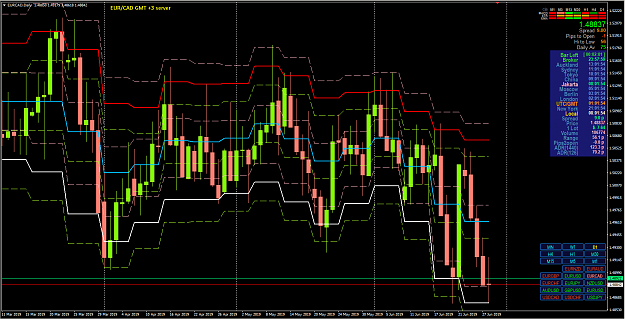
On ADR and Centered MA I have been doing my planned exercise but something caught my attention as we visited the ADR conversation again. I always look out for simplicity, and I hope the EA R4M is building will have as simple logic as possible. May be all the answer we are busy looking for is in ADR. So I pulled up a daily chart, applied the NIH Centered TMA as seen in the picture below. Set interpolate to false, W1 and half length of 1. I just wanted to see how price responds to the centre line based on ADR. I see the price hugs the centre line....
Ignored
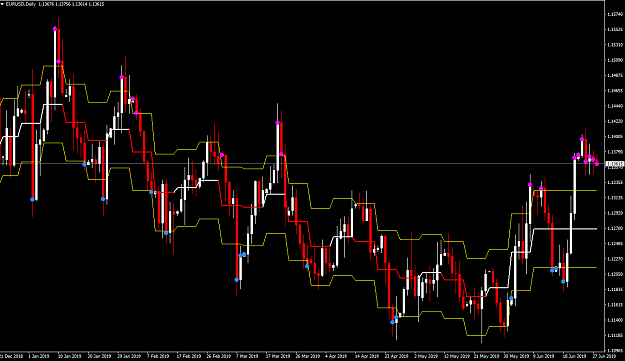
@bishopdotun -- your strategy looks interesting to me -- especially since it is spike-related plus your recipe (i.e. rules) were so clear. So, I created a new indicator called R4M-BishopDotunADRIndi.ex4 -- here's the link:
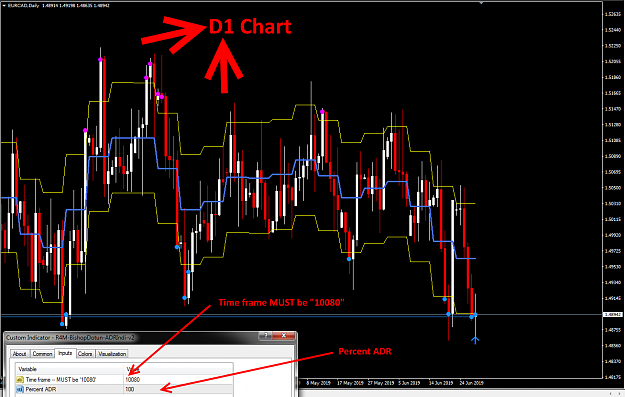
To be clear -- this indicator should only be run in a D1 chart.
Below is a screen shot of the indicator -- I think I've followed your rules and the results look great -- almost too good...
Attached Image (click to enlarge)
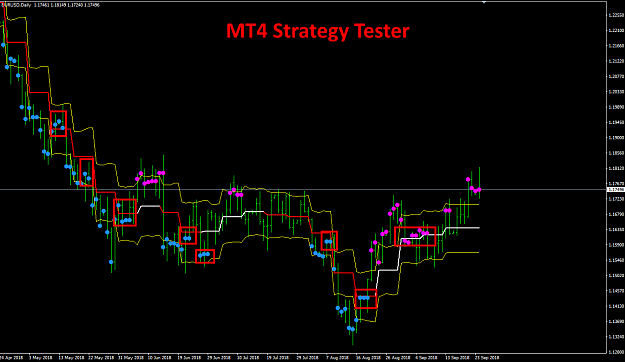
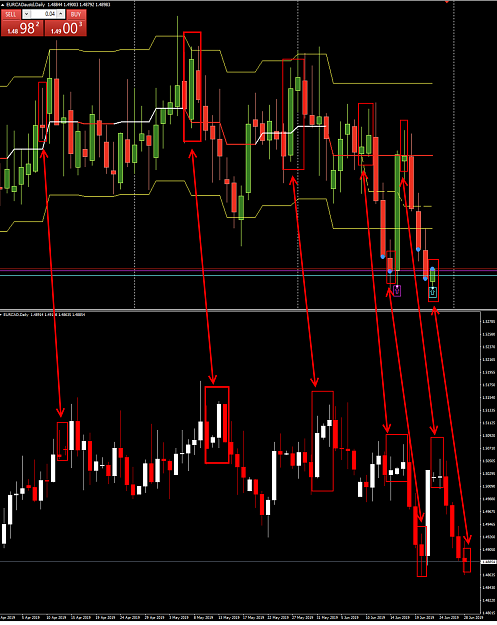
I then ran the indicator under MT4's Strategy Tester -- and the results look less great.
Attached Image (click to enlarge)
In the screen shot above I've placed red rectangles around BUY/SELL signals that no longer fall outside the ADR bands. The indicator does NOT repaint. Here's what is happening. Since you are using a higher time frame -- W1 -- then it doesn't get computed until the end of the week. But you are trading every day based on the previous week's ADR band. At the time the purple and blue dots were drawn they did fall outside the ADR bands. But, when the week is over and the ADR band for the just completed week gets computed and drawn, then often times dots no longer fall outside the bands.
I don't know if there is a solution. It looks like a good start and perhaps there is a filter that can be applied -- I don't know. It may be that because the strategy relies on a higher time frame that hasn't yet been computed at the time trade decisions are made, then there is no way around it.
Anyways -- if you are interested then please experiment and let me know what you think.
{quote} @bishopdotun -- your strategy looks interesting to me -- especially since it is spike-related plus your recipe (i.e. rules) were so clear. So, I created a new indicator called R4M-BishopDotunADRIndi.ex4 -- here's the link: {file} To be clear -- this indicator should only be run in a D1 chart. Below is a screen shot of the indicator -- I think I've followed your rules and the results look great -- almost too good... {image} I then ran the indicator under MT4's Strategy Tester -- and the results look less great. {image} In the screen shot...
Ignored
While this is on a larger TF, I think this gives a good illustration of what is really happening on the smaller TF's, but because it is a much larger TF we see it playing out much better.
Some people say I'm lucky, but the more I practice the luckier I get
{quote} @bishopdotun -- your strategy looks interesting to me -- especially since it is spike-related plus your recipe (i.e. rules) were so clear. So, I created a new indicator called R4M-BishopDotunADRIndi.ex4 -- here's the link: {file} To be clear -- this indicator should only be run in a D1 chart. Below is a screen shot of the indicator -- I think I've followed your rules and the results look great -- almost too good... {image} I then ran the indicator under MT4's Strategy Tester -- and the results look less great. {image} In the screen shot...
Ignored
thanks for your effort. i will also give this a spin
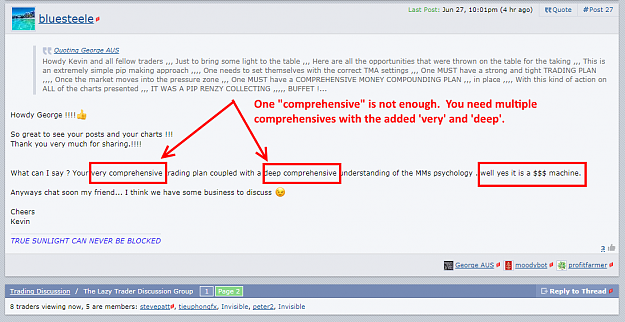
Just in from the 3 Musketeers -- turns out theirs is now a $$$ machine !!!
https://www.forexfactory.com/showthread.php?p=12354893#post12354893
Attached Image (click to enlarge)
I'm surprised @George allows @bluesteele to keep posting on his behalf -- each time it gets worse and sounds more desperate. The non-trading system with no Entries or Exits, that is not allowed to be discussed, has now morphed into a $$$ machine. And @George's stated goal is to save humanity and help inexperienced traders? Hyping one's psychology as a $$$ machine helps struggling traders? Really?
I hope the boys over in the @scammers thread have their eyes on this one. @bluesteele used to lead the charge in accusing OP's of misleading the "newbies" as they like to call many of us. Wouldn't it be a riot if he were to get eaten by some of his own. I also hope the boys over in the @scammers thread look into some of the pseudopods the 3 Musketeers have been using to pad their subscribers and inflate the number of "likes" they get for their wacky posts.
I'm looking forward to the upcoming pod cast #3 -- with all the new details promised it's sure to be a box office smash.
EDIT: Oh yes, and @bluesteele thinks it plays well to announce he and @George have some "business" to discuss -- wink, wink. Why not let @George know by using PM? I wonder what @bluesteele's agenda is by letting everyone know. Hmmmmm -- sounds interesting.
{quote} While this is on a larger TF, I think this gives a good illustration of what is really happening on the smaller TF's, but because it is a much larger TF we see it playing out much better.
Ignored
@Robot Trader -- yes, it looks nice in hindsight from 30,000 feet high (i.e. the higher TF), but you can't trade it because the higher TF data is not available at the time you actually trade. In other words, it's not a real-time system.
I'm not counting this out -- there certainly is some relationship with ADR going on here. I mean, we've seen this on several occasions in the past. I remember a classic one shared by @rosalieone a while back. I'm betting @bishopdotun will come up with another variation...
{quote} Just relax and be entertained by the 3 crowns plus 1 over at the commercial session.
Ignored
@mixedbags -- relax? Never. Until now they've had the luxury of choosing when / where to target me -- that's how predator types operate. Once they smell blood they'll never go away. Since I'm stuck with them -- they will forever keep trying to stab me in the back -- then my best defense is to take the offense to them from time-to-time. I'm a foolish old man with nothing to sell and no reputation to lose. But they need the attention and their reputation is important to them -- and, so, now they are flailing away and have no direction. No question they'll be back -- so I just want to get my licks in while I can.
That was quite fast. Thank you. Start of something cool.
Actually the drawing of the last 2 weeks is wrong. I overlay the R4M-Bishop indi on NIH Centered TMA. You immediately notice that the yellow line is below the red middle line. The Red thick middle line was drawn by R4M-Bishop indi while the dashed yellow line was drawn by NIH Centered TMA. There is clear difference.
Look further down, I drew 2 arrows and 2 lines coloured blue and magenta.
Attached Image (click to enlarge)
Magenta: Signal Line (day close > ADR distance from dashed yellow midline for last week), Arrow (open of the new candle and trade)
Blue: Signal line(day close > ADR distance from dashed yellow midline for this week), Arrow (open of new candle and trade)
dashed yellow line for this week is the take profit.
That was quite fast. Thank you. Start of something cool. Actually the drawing of the last 2 weeks is wrong. I overlay the R4M-Bishop indi on NIH Centered TMA. You immediately notice that the yellow line is below the red middle line. The Red thick middle line was drawn by R4M-Bishop indi while the dashed yellow line was drawn by NIH Centered TMA. There is clear difference. Look further down, I drew 2 arrows and 2 lines coloured blue and magenta. {image} Magenta: Signal Line (day close > ADR distance from dashed yellow midline for last week), Arrow...
Ignored
@bishopdotun -- okay, excellent. Looks like I have some more work to do. Does everything else look right -- and it's just the last 2 weeks?
@bishopdotun -- thanks for persisting and looking deeper. I really hope you are on to something. Since your strategy is so simple and since I now have a baseline indicator to work with, I'm willing to keep refining it if you will provide the direction.
{quote} @bishopdotun -- your strategy looks interesting to me -- especially since it is spike-related plus your recipe (i.e. rules) were so clear. So, I created a new indicator called R4M-BishopDotunADRIndi.ex4 -- here's the link: {file} To be clear -- this indicator should only be run in a D1 chart. Below is a screen shot of the indicator -- I think I've followed your rules and the results look great -- almost too good... {image} I then ran the indicator under MT4's Strategy Tester -- and the results look less great. {image} In the screen shot...
Ignored
Excellent work guys, I’m impressed. Much easier to trade MM on higher Time frames with reversals. Will give this a test in an automated fashion.
{quote} @bishopdotun -- okay, excellent. Looks like I have some more work to do. Does everything else look right -- and it's just the last 2 weeks? @bishopdotun -- thanks for persisting and looking deeper. I really hope you are on to something. Since your strategy is so simple and since I now have a baseline indicator to work with, I'm willing to keep refining it if you will provide the direction.
Ignored
At the current state of the indi, there is still some value to be derived. Assuming the signals doesn't repaint and you make the ADR % selectable, then I can play around with that. From visuals alone, the drawing of the current ADR looks to be 50% off from the NIH Centered TMA indi.
So if you increase the ADR% to say 150%, then you will eliminate a lot of the signals. Remember we are hunting spikes that deviate significantly from the normal price movement. There is sufficient evidence from the visuals alone that playing around with ADR% of the R4M-Bishop indi will provide a lot fewer and safer signals we can live with across 28 pairs.
Edit:Anyways I think you should first address the changes to make it align with NIH Centered TMA indi. for the current week. After that we will evaluate. Trading is done now not in the past. I am more interested in price deviation from the centre now. I think thats where the edge is.
{quote} At the current state of the indi, there is still some value to be derived. Assuming the signals doesn't repaint and you make the ADR % selectable, then I can play around with that. From visuals alone, the drawing of the current ADR looks to be 50% off from the NIH Centered TMA indi. So if you increase the ADR% to say 150%, then you will eliminate a lot of the signals. Remember we are hunting spikes that deviate significantly from the normal price movement. There is sufficient evidence from the visuals alone that playing around with ADR%...
Ignored
@bishopdotun -- okay, I've updated the indicator. Starting from a different centered TMA indicator (from @rajivxxx) then the problem with the most recent two weeks seemed to get resolved. Here is a link to the new version:
Again, for anyone keeping score, this indicator will only work on a D1 chart.
Attached Image (click to enlarge)
@bishopdotun -- a few notes:
1. I've added a "Percent ADR" setting so you can experiment with different distances from the midline.
2. If you look closely some of our data bars differ -- not by much, but it's clear our brokers use different data feeds.
3. Regarding the horizontal lines and arrows -- this is how I interpreted your instructions:
Only the most recent signal will get a horizontal line plus arrow. For a BUY trade the colors will be blue. And if it is a SELL trade then the colors will be purple.
[인용 = robots4me; 12356552] {인용} @ 비숍 도툰 - 알았어, 지시기를 업데이트했다. 다른 중심의 TMA 표시기 (@rajivxxx에서)에서 시작하여 가장 최근의 2 주 문제가 해결 된 것으로 보입니다. 새로운 버전에 대한 링크는 다음과 같습니다. {file} 다시 말하지만, 점수를 유지하는 사람에게는이 표시기가 D1 차트에서만 작동합니다. {이미지} @ 비숍 도턴 - 몇 가지 메모 : 1. 중간 선에서 다른 거리를 실험 할 수 있도록 "백분율 ADR"설정을 추가했습니다. 2. 당신이 밀접하게 우리의 데이터 막대의 일부가 다르다면 많이 다르지는 않지만 브로커가 다른 데이터 피드를 사용하는 것은 분명합니다. 3. 수평선과 화살표에 관해서 - 이것은 당신의 지시 사항을 해석하는 방법입니다 : 오직 가장 최근의 신호 만이 수평선과 화살표를 얻을 것입니다. 매수 (BUY) 거래의 경우 색상은 파란색입니다.
{quote} @bishopdotun -- okay, I've updated the indicator. Starting from a different centered TMA indicator (from @rajivxxx) then the problem with the most recent two weeks seemed to get resolved. Here is a link to the new version: {file} Again, for anyone keeping score, this indicator will only work on a D1 chart. {image} @bishopdotun -- a few notes: 1. I've added a "Percent ADR" setting so you can experiment with different distances from the midline. 2. If you look closely some of our data bars differ -- not by much, but it's clear our brokers...
Ignored
Is it possible to build into indicators (Like what you can do with EA's) Text that displays your Brokers current Server Time, then when we post charts it will be easy to see why the results differ.
Some people say I'm lucky, but the more I practice the luckier I get
{quote} Is it possible to build into indicators (Like what you can do with EA's) Text that displays your Brokers current Server Time, then when we post charts it will be easy to see why the results differ.
Ignored
@Robot Trader -- yes, that's easy to do. I haven't been doing it for the indicators I've posted here, but I'll typically display the current Server time in the lower-left corner.
Typically results shouldn't differ, though. However, I noticed many discrepancies when comparing the chart @bishopdotun posted with the chart from my broker. In @bishopdotun's chart there are bars that are missing and most of our wicks are different sizes. I've never noticed that before. I wonder whether it's due to different broker times. My charts come from a GMT+0 broker. I wonder whether @bishopdotun's charts come from a GMT+2 broker.
I bet @Nih08 has an explanation.
I've posted a screen shot below to show some of the differences:
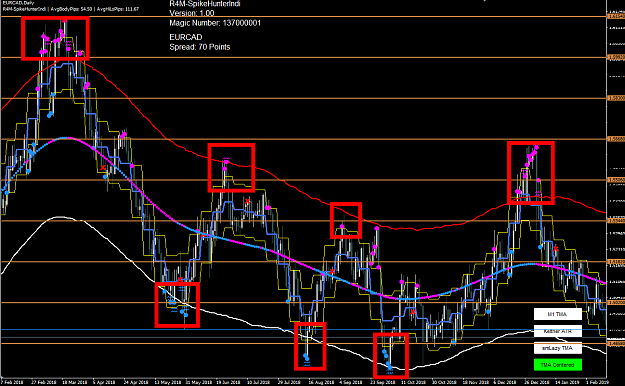
I just now overlayed SpikeHunter on the BishopDunton indicator. I know the chart looks messy (and must have the 3 Musketeers ROFL) but I wonder if I'm the only one who sees the pattern. This is still reversal trading, but at a much higher time frame. It could use some cleaning-up because not all the visual elements are necessary. I think @bishopdotun may be on to something. It could be interesting to explore further.
Also, just as interesting, @Nih98's SweetSpots line up almost perfectly -- though that may be expected, since his SweetSpot indicator computes a weekly average, or something like that.
Another thing just occurred to me, though @bishopdotun may have already been thinking about this when he designed the strategy.
When trading large TF's your drawdowns aren't a few pips, they could be dozens of pips. But @bishopdotun's strategy may be safer since not only is it trading extremes, it's trading extremes at the edge of ADR bands. Since the price is already at the edge of the ADR then the likelyhood of it reversing back to fair value is probably higher than a reversal that occurs somewhere in the middle of the ADR. Do you know what I mean?
I just now overlayed SpikeHunter on the BishopDunton indicator. I know the chart looks messy (and must have the 3 Musketeers ROFL) but I wonder if I'm the only one who sees the pattern. This is still reversal trading, but at a much higher time frame. It could use some cleaning-up because not all the visual elements are necessary. I think @bishopdotun may be on to something. It could be interesting to explore further. Also, just as interesting, @Nih98's SweetSpots line up almost perfectly -- though that may be expected, since his SweetSpot indicator...
Since the price is already at the edge of the ADR then the likelyhood of it reversing back to fair value is probably higher than a reversal that occurs somewhere in the middle of the ADR. Do you know what I mean?
Ignored
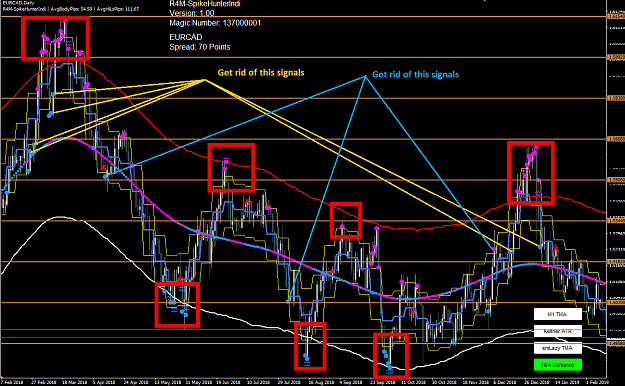
I have identified a few signals that are not that efficient into 2 groups that's shown on the chart. Take a look.
{quote} @Robot Trader -- yes, that's easy to do. I haven't been doing it for the indicators I've posted here, but I'll typically display the current Server time in the lower-left corner. Typically results shouldn't differ, though. However, I noticed many discrepancies when comparing the chart @bishopdotun posted with the chart from my broker. In @bishopdotun's chart there are bars that are missing and most of our wicks are different sizes. I've never noticed that before. I wonder whether it's due to different broker times. My charts come from a...
Ignored
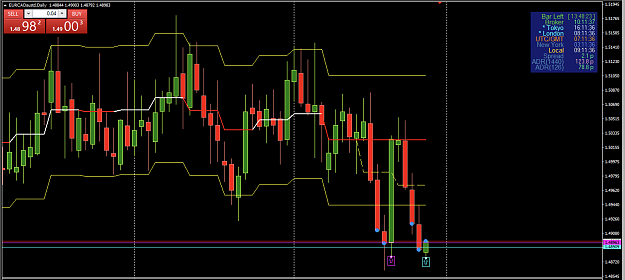
Hi Bro R4M, for TF H1 down to M1, different 'retail' brokers will give you different candle range depend on 'spread' and 'hidden point' addition from your broker, so it will not give big different and the different GMT time broker servers not give impact. But, for H4 up, the main different will be GMT time broker servers. There's broker servers that add 'weekend candle' to their tick data, and mostly they start the week at same time, but end the day and week with different time depend on their GMT area, this will give you different candle shape on TF H4 up. Most easy to compare if you have GMT 0 broker server, and GMT +3 broker server then both TF H4 candles will be different shape because of the different at Open and Close time.
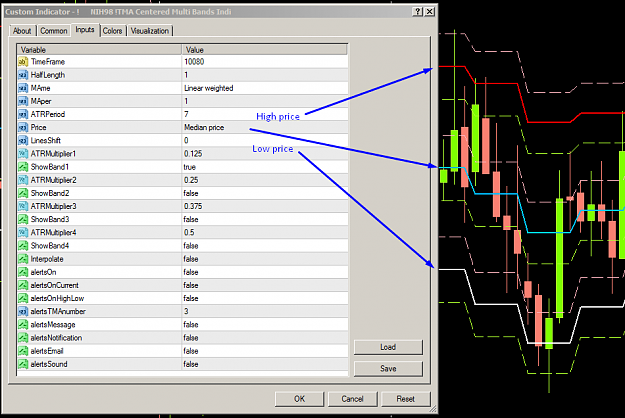
EUR/CAD Daily Chart GMT+3
Attached Image (click to enlarge)
my TMA centered setting (3 instances for High, Mid, and Low)