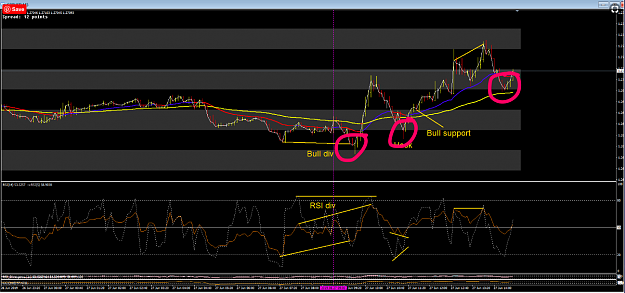
{quote} Can u see the V on the chart? and the W in RSI? in fact I took this same trade today... was a great setup i posted this trade in my 1st pic
Ignored
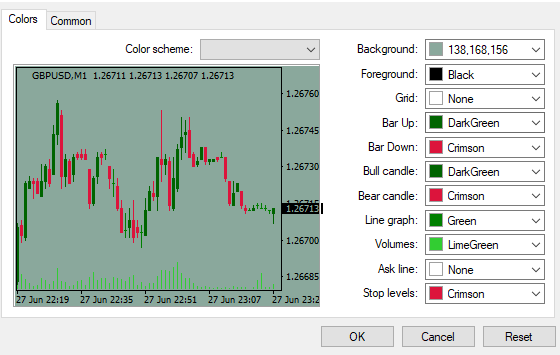
i can see the 'W' in the rsi, and on my rsi settings (the ones used here in the thread) its at the point that there's a bull rsi/rsi divergence and not a regular like on your chart. About the 'V' on the chart, i can see a few but i dont know which you mean. By the way what is the backgroung color you are using, like it.
{quote} i can see the 'W' in the rsi, and on my rsi settings (the ones used here in the thread) its at the point that there's a bull rsi/rsi divergence and not a regular like on your chart. About the 'V' on the chart, i can see a few but i dont know which you mean. By the way what is the backgroung color you are using, like it.
{quote} i can see the 'W' in the rsi, and on my rsi settings (the ones used here in the thread) its at the point that there's a bull rsi/rsi divergence and not a regular like on your chart. About the 'V' on the chart, i can see a few but i dont know which you mean. By the way what is the backgroung color you are using, like it.
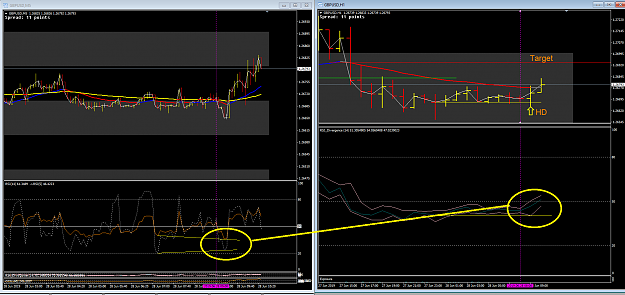
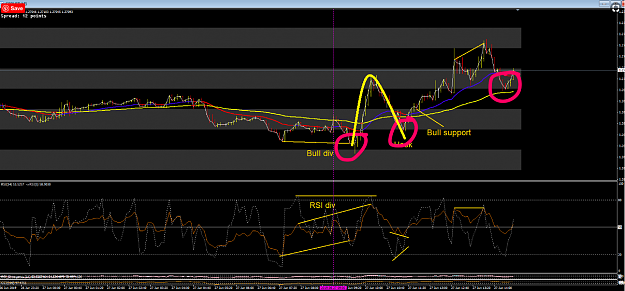
{quote} Allow me... I see 4 HDs so far and 1 RSI div which Jazz shows. {image}
Ignored
I been trading 6 years, And this is the Best strategy i have came across, looking to be here a long time.. 1 pairs endless trades both ways crazy. Yes i am still learning the ABCD, & some other stuff to, but that is not stopping from making pips daily. Thanks for having the best thread around... between HD and Reg Div this is crazy pips... yes i know you dont have to trade them all, Patience brings some good trades for sure. nothing like trading 1 pair... easy peasy
also getting my stacks down so i can start making 100% account size wins or close to it anyways
{quote} Thanks Alan, those posts were helpful; however, I was specifically wondering at what point you enter your first order after seeing a divergence print? Do you simply enter as soon as the divergence has printed, or do you wait for the break of the previous candle's high/low, etc? I suppose I have the same question for your second and third entries. Cheers
Ignored
Hmm, I think because I'm new to the forum and my posts are being hand-moderated they are also being delayed and somewhat buried...
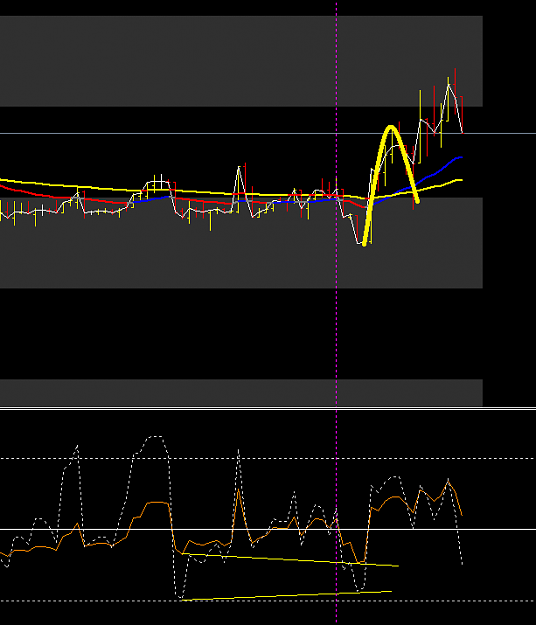
Here is an example of the hook, you can see late entries are exposed to it. {image}
Ignored
Hi Alan
Actually, how did you trade today?
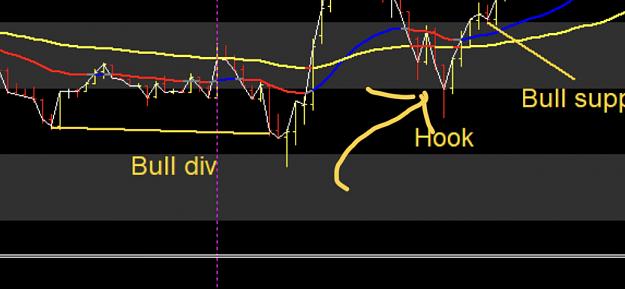
If you went long at the bullish div, would you stop out (probably lock in some profit) at/before the hook? and if you went short later the day, would you again stop out at the last circle that I draw on the chart, due to lock in some profit probably?
Could you share your mindset during those point at time please?
{quote} Hi Alan Actually, how did you trade today? If you went long at the bullish div, would you stop out (probably lock in some profit) at/before the hook? and if you went short later the day, would you again stop out at the last circle that I draw on the chart, due to lock in some profit probably? Could you share your mindset during those point at time please? {image}
Ignored
O my goodness I am very rarely in a trade for that length of time.
I was short at the 108 = RSI div
Then long at the bull div and completed my trading. About an hour, just a tad over.
{quote} O my goodness I am very rarely in a trade for that length of time. I was short at the 108 = RSI div Then long at the bull div and completed my trading. About an hour, just a tad over.
Ignored
I actually expect this, you usually complete early.
Today when I look the chart, I don't find any signal, but one obvious thing is, there is a flat zone of support around 1.2668, the bull doesn't allow it to go south, but whenever bull starts attack, it got beaten up. Price on M5 and m15 are both on 26EMA, on h1 is below ema. no div that I see so far.
Can you share your opinion or past experience when seeing similar market condition please?
{quote} I don't know what you are talking about with all this delay stuff. There is no delay. We enter at exactly the time the lower time frame signal is given. If we delay we are more than likely going to be stopped out.
Ignored
Hi,
I'm a bit confused about this also, trying to get the hang of the entries. So, we enter after we find the inference of a higher timeframe, and when this happens we go to the M5 and look for the signal, that we take ideally in the close of the bar that creates it, without waiting for the pivot to be confirmed in the close of the next bar.
But shouldn't we take the entries as two bar tests? (I was doing it like so for the first phase of the entries and missed quite a few chances). Or are they intended more as an option/safety net for entries without inferences, or entries done in the bigger timeframe directly?
{quote} Hi, I'm a bit confused about this also, trying to get the hang of the entries. So, we enter after we find the inference of a higher timeframe, and when this happens we go to the M5 and look for the signal, that we take ideally in the close of the bar that creates it, without waiting for the pivot to be confirmed in the close of the next bar. But shouldn't we take the entries as two bar tests? (I was doing it like so for the first phase of the entries and missed quite a few chances). Or are they intended more as an option/safety net for entries...
Ignored
When yo do a two bar test and that can be anywhere all you are doing is defining your entry and your stop.
When we a something to go by on the higher time from we have a ZOO point. This is our signal but we have to find an entry so we simply drop to the lower time frame and look there for one. So we don't delay at this lower time frame the delay may be on the higher one while we look for the entry.
For example if we have a div on the hour we have about 12 bars on the 5 min to look for an entry.
{quote} Hmm, I think because I'm new to the forum and my posts are being hand-moderated they are also being delayed and somewhat buried... But I'm still keen to know the answer! Cheers
Ignored
How many times do I have to say immediately.
I am watching and seeing this looks like it is going to close in a div...waiting, waiting YES! CLICK I am in