{quote} These videos are fabulous! It's like you said above: S/R is more important than indicators. Thank you for posting these! Do you recommend the Trading Channel's EAP course? Do you know anyone who has taken it?
Ignored
i have not taken the course. i just chanced upon it and thought that it was good.
i shall be going through their videos.
1) trading around higher time frame support and resistance will increase our chance of winning. it will also limit our over trading.
2) trade entry in lower time frame according to our experience. eg. 3 brp, good candle close beyond fractal or higher high higher low.
{quote}1) trading around higher time frame support and resistance will increase our chance of winning. it will also limit our over trading. 2) trade entry in lower time frame according to our experience. eg. 3 brp, good candle close beyond fractal or higher high higher low.
I want to thank you for teaching me a lot with these indicators, and the scalping. It took me a while, but I had to read everything on here. I like the way you introduced be to Heiken Ashi and the RSI 50 along with all the other indicators that all compliment each other.
As far as Support and resistance. (Or supply and demand zones) which are just about the same thing.
I found this on youtube. to make drawing supply and demand zones easy to draw.
Inserted Video
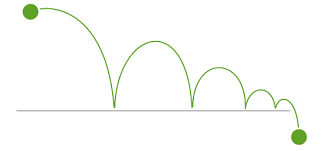
I also use this image as a metaphor to how a pair breaks through the support lines
{quote} Hello Inthebox, I want to thank you for teaching me a lot with these indicators, and the scalping. {image}
Ignored
thank you for your interest.
those purists would have insist that support/resistance is different from supply/demand. LOL.
support/resistance zone remains no matter how many times price passes through them.
supply/demand zone is no longer in use when price crossed/absorbed/consumed it. when price crossed up a supply zone, later a new demand zone is then drawn.
yes, the image that you have shown indicates that the bounce from the supply line is getting weaker with each bounce.
i started off with the smaller time frame with the indicators. however there are many things in the bigger picture that one cannot see.
so now, i am looking at the higher time frame with the support/resistance zone and entering trades there with lower time frame.
they can be short term or medium term.
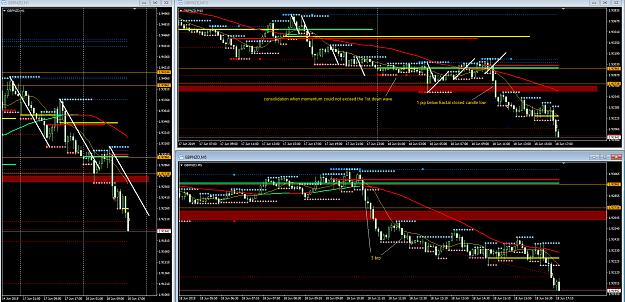
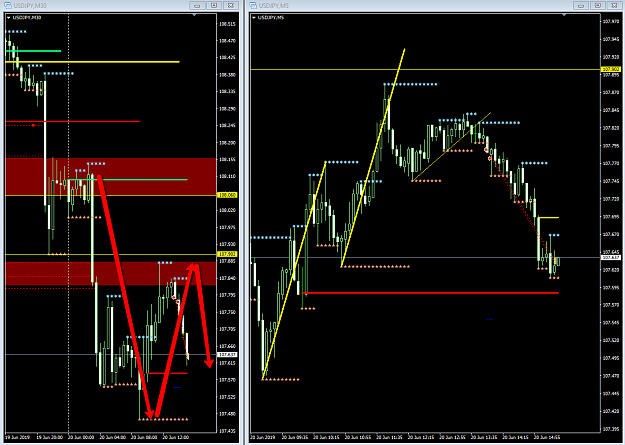
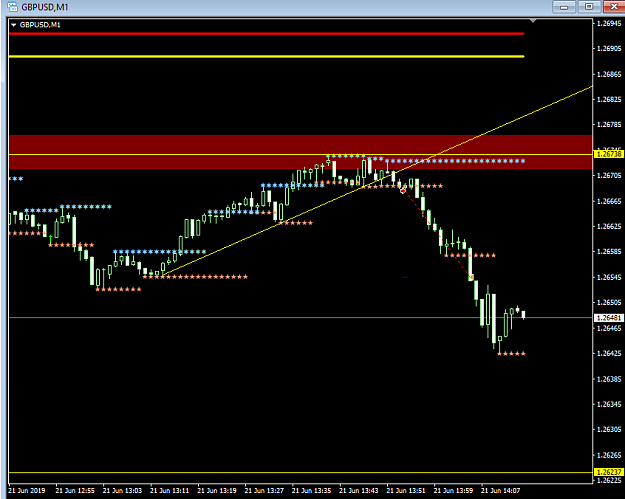
no candle closed below the m5 or m1 lower fractal when price sliced through the lower resistance.
1st entry attempted above the lower resistance when there was a 4 fractal lower low lower high in m1.
2nd and 3rd entries at candle closed below m5 lower fractal.
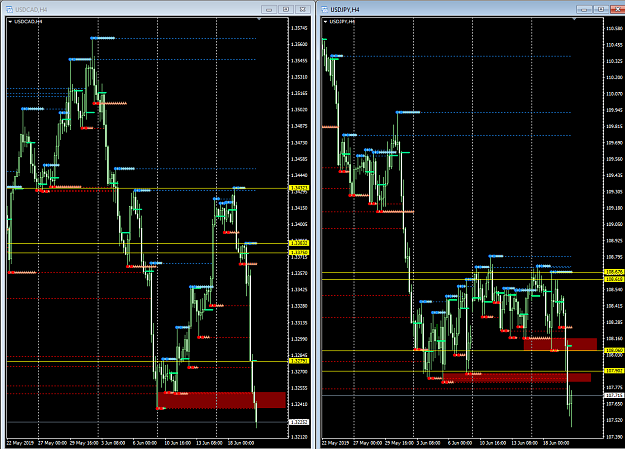
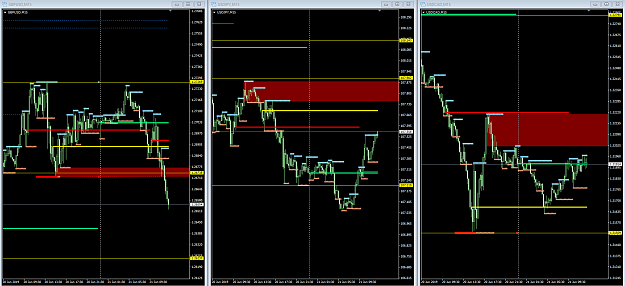
price could not break through the confluence of h4 upper resistance and trend line.
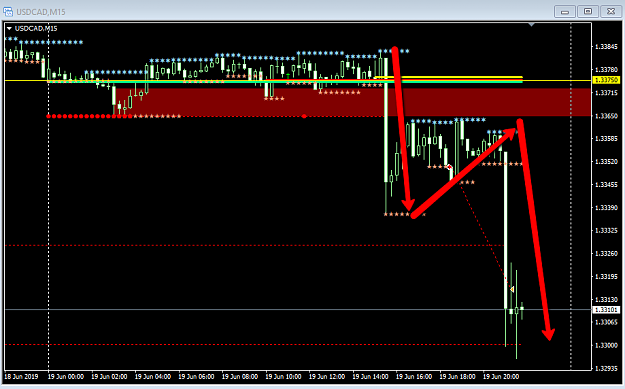
usdcad is a runnaway trend.
usdjpy. price retest the support turned resistance and there was a lost in momentum there.
1st entry below m5 trend line and fractal.
2nd entry trailing 1 pip below m30 candle low.
exit before usd news.
{quote} thank you for your interest. those purists would have insist that support/resistance is different from supply/demand. LOL. support/resistance zone remains no matter how many times price passes through them. supply/demand zone is no longer in use when price crossed/absorbed/consumed it. when price crossed up a supply zone, later a new demand zone is then drawn. yes, the image that you have shown indicates that the bounce from the supply line is getting weaker with each bounce. i started off with the smaller time frame with the indicators....
Ignored
You're right, Support and Resistance lines is what matters. Do you think Ichimoku Cloud is helpful in confirming a trend, if all the combined indicators act as one?
{quote} You're right, Support and Resistance lines is what matters. Do you think Ichimoku Cloud is helpful in confirming a trend, if all the combined indicators act as one?
Ignored
indicators are derived from price and somewhat 'lagging' averages. so entries will be in the middle of the trend.
but if one goes into detailed study and know the intricacies of the indicator, it can be put to good use.
eg. the application using multi time frame - htf for trend, ltf for entry.
all of us has different understanding and interpretation if presented with a picture or chart - it's relative.
personally i find that using support and resistance for setup entry can get me into earlier entry than using indicators.
then at times when looking at htf, the entry can be at the tip of the pin bar.
it's all about catching one good trend -> retracement -> one good candle for entry.
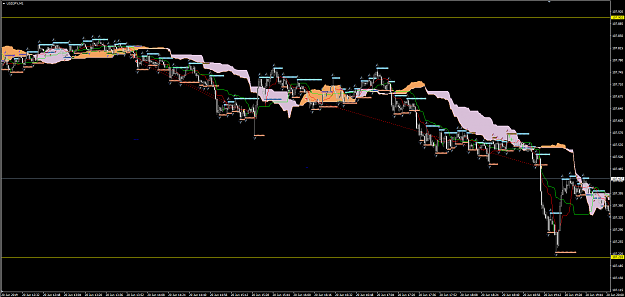
ichimoku cloud can be combined with support and resistance like this rockypoint guy's thread.
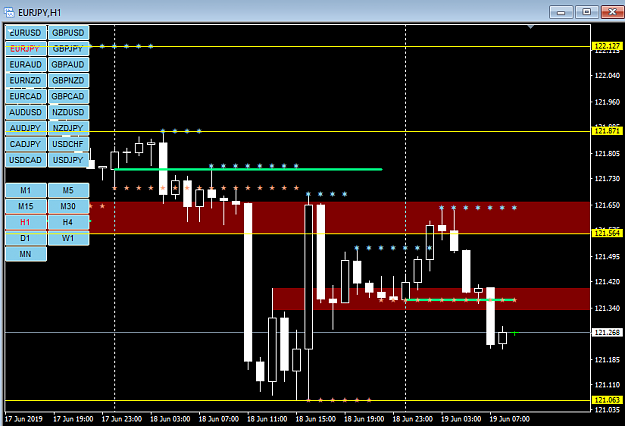
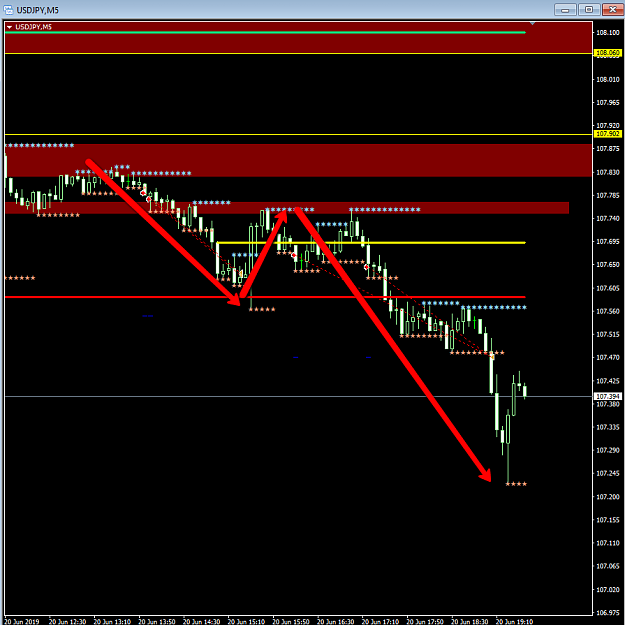
i put on my yesterday's usdjpy trades in m1. yellow line above was the previous day's low resistance.
it also looks good when less cluttered. just using the fractals and main cloud with no other lines.