A lazy simplistic tool for simplistic lazy traders. {image}
Ignored
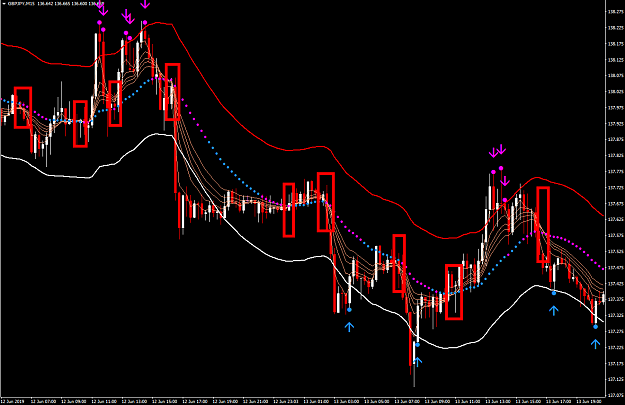
Keeping with the spirit of @parisboy's preference for simplistic tools for lazy traders, I've attached the Guppy Multiple Moving Average (GMMA) indicator. You can see how the MA crossings frequently precede a spike. Not every crossing leads to spike, but they occur "more often than not". And when a pattern occurs "more often than not", then there may be an edge to be had.
.....you show me a chart over a 1 week period that is not doing this and I will show you a TF where even in a Ranging market PA is still making higher highs and lower lows.
You have never been able to do it because you have not studied how PA is moving on every TF, you will have built your strategy/EA on just one TF and that does not work. ----------- Robot Trader
This is a good post on the other thread. Study it carefully on your charts to properly understand the true fractal nature of market structure. There are plenty of trading opportunities to be had both in trending and ranging markets, the universal principle remains the same.
Robot Trader is spot on correct about reversal trades being the most difficult that he wrote in his previous post somewhere. That's because the deviation is unbounded and theoretically can be infinity.
One way to muster unbounded reversal points is by the use of George's target method as price enters TMA pressure zone.
Another approach is the use of momentum strategy. Reversal points can be broadly categorised into 2 categories, ie. V shape or U shape. V shape reversal point is most exposed to unbounded deviation. Whereas U shape reversal point demonstrates standard momentum characteristic whose deviation is limited that can be exploited. Again to the human eye the reversal points look random, volatile and chaotic.
This means the proverbial "catch the falling knife" or "waterfall" reversal points under certain specific conditions by applying effective strategies can be traded safely making them good trading opportunities to exploit.
.....you show me a chart over a 1 week period that is not doing this and I will show you a TF where even in a Ranging market PA is still making higher highs and lower lows. You have never been able to do it because you have not studied how PA is moving on every TF, you will have built your strategy/EA on just one TF and that does not work. ----------- Robot Trader This is a good post on the other thread. Study it carefully on your charts to properly understand the true fractal nature of market structure. There are plenty of trading opportunities...
Ignored
Quote
Disliked
One way to muster unbounded reversal points is by the use of George's target method as price enters TMA pressure zone.
Yep -- and that's what we are doing.
Quote
Disliked
Another approach is the use of momentum strategy.
Yep -- we are using @Nih98's FX RSI indicator as a momentum filter.
Also, thanks to @nigpig and @skyway -- I've learned that TMA slopes may also serve as a very effective filter, as well.
Quote
Disliked
proverbial "catch the falling knife" or "waterfall" reversal points
@skyway -- I don't think that is what we are doing. Catching the "falling knife" refers to catching the spike. We don't catch a knife -- we pickup the knife after it has hit the floor (or ceiling). Yes -- the "window" of the reversal may be more narrow than trend following, but it often lasts several bars. And if we allow an indicator alert (or EA) to detect the reversal, then the narrowness of the reversal becomes less important. In fact, in some ways it becomes easier to trade because there is no question as to when to enter a trade.
@skyway -- BTW -- you don't need to end your posts with "My 2cts". They are worth a lot more. I'd value them around, say 11 or 12 cts.
Just thought I would add a bit more Text to my earlier chart regarding filters that could be used within your indicator.
Day traders are looking for S&R for quick in/out trades, so I marked up the chart showing this.
I think a good filter would be for the indicator to count short term Tops/Bottoms (it does not need to go back many weeks)
The Text on my chart explains how this type of filter could work, but you are looking for at least two Tops/Bottoms to establish there will be a Stop Hunt.
Regards
RT
Attached Image (click to enlarge)
Some people say I'm lucky, but the more I practice the luckier I get
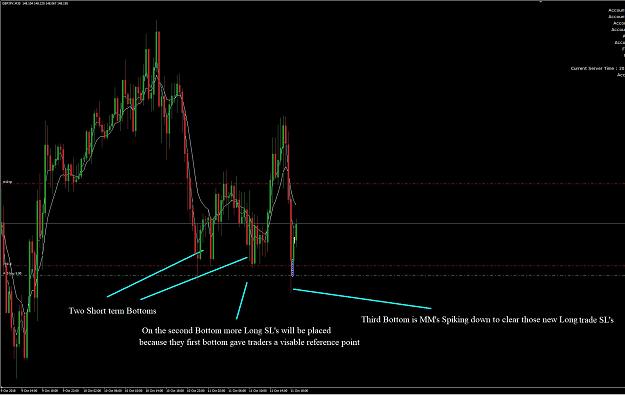
Hi R4M, Just thought I would add a bit more Text to my earlier chart regarding filters that could be used within your indicator. Day traders are looking for S&R for quick in/out trades, so I marked up the chart showing this. I think a good filter would be for the indicator to count short term Tops/Bottoms (it does not need to go back many weeks) The Text on my chart explains how this type of filter could work, but you are looking for at least two Tops/Bottoms to establish there will be a Stop Hunt. Regards RT {image}
Ignored
I'm also very interested in this concept of fake S&R's. Not sure if you are able to code this into an indi but pretty sure it would give great results. Yet another filter that could be applied.
Hi R4M, Just thought I would add a bit more Text to my earlier chart regarding filters that could be used within your indicator. Day traders are looking for S&R for quick in/out trades, so I marked up the chart showing this. I think a good filter would be for the indicator to count short term Tops/Bottoms (it does not need to go back many weeks) The Text on my chart explains how this type of filter could work, but you are looking for at least two Tops/Bottoms to establish there will be a Stop Hunt. Regards RT {image}
{quote} I'm also very interested in this concept of fake S&R's. Not sure if you are able to code this into an indi but pretty sure it would give great results. Yet another filter that could be applied.
Ignored
@Robot Trader, @LongBTC, @skyway -- yes, I agree. The next version of the indicator will include a setting to enable the TOPS/BOTTOMS algorithm that makes up the MM Detective indicator. I'm working on that as we speak.
Hi R4M, Just thought I would add a bit more Text to my earlier chart regarding filters that could be used within your indicator. Day traders are looking for S&R for quick in/out trades, so I marked up the chart showing this. I think a good filter would be for the indicator to count short term Tops/Bottoms (it does not need to go back many weeks) The Text on my chart explains how this type of filter could work, but you are looking for at least two Tops/Bottoms to establish there will be a Stop Hunt. Regards RT {image}
Ignored
@Robot Trader -- thanks for the charts and explanations. Awhile back I learned from @George that prices are manipulated and there is some master algorithm at work in the background gobbling-up stop losses to increase liquidity. I get that. And it is interesting to weave a narrative as to why a spike occurred here or there.
But let me ask you this -- if all I care about is trading, then why do I care about the narrative? At this point all I want to do is algorithmically detect spikes, distinguish between true and false signals, and open a new BUY or SELL position. The explanation as to why a spike occurred where it did only comes in the aftermath, right? You can't provide the explanation in advance. I can't trade the explanation.
The immediate aftermath of a spike == MM showing its hand. I don't need to know why the price spiked. All I need to know is that a spike occurred.
{quote} @Robot Trader -- thanks for the charts and explanations. Awhile back I learned from @George that prices are manipulated and there is some master algorithm at work in the background gobbling-up stop losses to increase liquidity. I get that. And it is interesting to weave a narrative as to why a spike occurred here or there. But let me ask you this -- if all I care about is trading, then why do I care about the narrative? At this point all I want to do is algorithmically detect spikes, distinguish between true and false signals, and open a...
Ignored
Hi R4M,
3 Strikes and you'r out, is the old saying, so on the Chart the third move down is the SL's are out.
We do not want to trade every Spike, we want the pressure to build up we are looking for reasons why the MM's will want to move the Market Higher or Lower, we are looking for that EDGE.
Regards
RT
Some people say I'm lucky, but the more I practice the luckier I get
{quote} Hi R4M, 3 Strikes and you'r out, is the old saying, so on the Chart the third move down is the SL's are out. We do not want to trade every Spike, we want the pressure to build up we are looking for reasons why the MM's will want to move the Market Higher or Lower, we are looking for that EDGE. Regards RT
Ignored
i like what you are looking at mate , looking forward to it well done
{quote} Hi R4M, 3 Strikes and you'r out, is the old saying, so on the Chart the third move down is the SL's are out. We do not want to trade every Spike, we want the pressure to build up we are looking for reasons why the MM's will want to move the Market Higher or Lower, we are looking for that EDGE. Regards RT
Ignored
@Robot Trader -- Yes, we do not want to trade every Spike. And that's where filters come in -- to distinguish between true spikes (i.e. true signals) and false positives (spikes we don't want to trade).
Doesn't @Nih98's momentum filter count for something?
Look it -- no doubt an experienced trader using discretionary trading will trump an indicator / EA any day. But the noble goal here is to get you out of that chair so you don't have to continuously watch the screen. That's what a rules-based indicator / EA can provide. But like everything in life it comes with a trade-off -- it won't be as consistent as you sitting in front of a screen. I just want to give people a choice -- if it must be 100% then that's fine and you can sit in front of the screen and attempt to trade according to @George's methodology. But if "good enough" is "good enough", then an indicator / EA is another option.
{quote} @Robot Trader -- Yes, we do not want to trade every Spike. And that's where filters come in -- to distinguish between true spikes (i.e. true signals) and false positives (spikes we don't want to trade). Doesn't @Nih98's momentum filter count for something? Look it -- no doubt an experienced trader using discretionary trading will trump an indicator / EA any day. But the noble goal here is to get you out of that chair so you don't have to continuously watch the screen. That's what a rules-based indicator / EA can provide. But like everything...
Ignored
Hi R4M,
OK from a Lazy trader prospective we can only really test how good the indicator and it's filters are through the use of an EA.
Otherwise we are back in our chairs again (or running back to the PC following an Alert) watching the indicator.
Regards
RT
Some people say I'm lucky, but the more I practice the luckier I get
{quote} Hi R4M, OK from a Lazy trader prospective we can only really test how good the indicator and it's filters are through the use of an EA. Otherwise we are back in our chairs again (or running back to the PC following an Alert) watching the indicator. Regards RT
Ignored
Quote
Disliked
Otherwise we are back in our chairs again (or running back to the PC following an Alert) watching the indicator.
True -- but the indicator can push alerts and sound an alarm to wake you up from a nap.
Seriously -- the indicator also has the advantage that it is completely objective. Given a particular data pattern, it will make the same decision every time. A human might waffle on making a decision. Of course, the indicator / EA is only as good as the coder. If the coder is sloppy or the rules aren't properly implemented then the indicator / EA can consistently get things wrong just as well as consistently get things right. Again -- it all comes down to trade-offs.
I'm hoping that with some assistance we can collectively come to an agreement that either the indicator / EA consistently gets things wrong or consistently gets things right. I'm only one guy and my testing is limited to my accounts and brokers. An indicator / EA really needs to be exercised by more than one person before it can be deemed to be of value.
I've been silently reading your thread lately, and man, let me tell you that I really admire and respect all your efforts/dedication, transparency and code of conduct. You are surely doing something that almost nobody here is capable of, in a very complete, correct and selfless way. So fist of all, thank you very much for openly sharing your work with the world, and without any absurd "hidden clues" or big EGO behind.
Hello @robots4me, I've been silently reading your thread lately, and man, let me tell you that I really admire and respect all your efforts/dedication, transparency and code of conduct. You are surely doing something that almost nobody here is capable of, in a very complete, correct and selfless way. So fist of all, thank you very much for openly sharing your work with the world, and without any absurd "hidden clues" or big EGO behind. Hats off to you, sir! Sincerely, Viktory
A lazy simplistic tool for simplistic lazy traders. {image}
Ignored
@parisboy,
If I correctly understood, do you use previous MA crosses to evaluate-confirm possible targets and tops/bottoms?
This is new to me... So how often are them accurate enough to be significant?
{quote} Keeping with the spirit of @parisboy's preference for simplistic tools for lazy traders, I've attached the Guppy Multiple Moving Average (GMMA) indicator. You can see how the MA crossings frequently precede a spike. Not every crossing leads to spike, but they occur "more often than not". And when a pattern occurs "more often than not", then there may be an edge to be had. {image} {file} {file}
Ignored
@robots4me,
... Because otherwise, any MA cross may look great in hindsight, but when they are moving along price in real-time of course it's a complete different story, and can easily change from converging to diverging until the corresponding price move has already developed, hence being too late to properly trade.
Hey guys, {quote} @parisboy, If I correctly understood, do you use previous MA crosses to evaluate-confirm possible targets and tops/bottoms? This is new to me... So how often are them accurate enough to be significant? {quote} @robots4me, ... Because otherwise, any MA cross may look great in hindsight, but when they are moving along price in real-time of course it's a complete different story, and can easily change from converging to diverging until the corresponding price move has already developed, hence being too late to properly trade. ---...
Ignored
Quote
Disliked
but when they are moving along price in real-time of course it's a complete different story
@Viktory -- MA crosses do not repaint or move along with price. The closed bar at which they first appear to cross is the bar at which they cross.
{quote} {quote} @Viktory -- MA crosses do not repaint or move along with price. The closed bar at which they first appear to cross is the bar at which they cross.
Ignored
@robots4me -- I mean when the current bar is still open and moving. With a very simple EA you can verify the inefficiency of MA crosses as mostly inaccurate signals.
{quote} @robots4me -- I mean when the current bar is still open and moving. With a very simple EA you can verify the inefficiency of MA crosses as mostly inaccurate signals.
Ignored
@Viktory -- correct. But most indicators and EAs do not use the current bar (index [0]). They typically use the most recent closed bar (index [1]). It depends on how the indicator is intended to be used. Since we are looking for spikes that touch a certain target price (e.g. within M1 TMA) then it is correct to use the current bar even though it is in flux.
When I posted the GMMA indicator I was simply going along with @parisboy's example that even indicators as simple as crossing MAs have value. If you look at @parisboy's charts and markings, he wasn't using crossing MAs as signals but, rather, pointed out they often precede a spike. I think he was attempting to share that another way to confirm a spike is real is if it is preceded by a crossing MA. Not all peaks that look like spikes to us are preceded by a crossing MA. That's all.
If I correctly understood, do you use previous MA crosses to evaluate-confirm possible targets and tops/bottoms? This is new to me... So how often are them accurate enough to be significant?