• Home
  • Forums
  • Trades
  • News
  • Calendar
  • Market
  • Brokers
  • Login
  • Join
  • User/Email: Password:
  • 8:57pm
Menu
  • Forums
  • Trades
  • News
  • Calendar
  • Market
  • Brokers
  • Login
  • Join
  • 8:57pm
Sister Sites
  • Metals Mine
  • Energy EXCH
  • Crypto Craft

Options

Bookmark Thread

First Page First Unread Last Page Last Post

Printable Version

Similar Threads

Planetary cycles, astrological theory of cycles of the markets 492 replies

Planetary / Astrology indicators 3 replies

Forecast Forex using Numeric Cycles and Astrology Cycles 32 replies

Planetary Cycles... Plotting Cycles into the Future 0 replies

Opinions on "Planetary cycles, astrological theory .. of the markets" 40 replies

  • Interactive Trading
  • /
  • Reply to Thread
  • Subscribe

Planetary Cycles Trading (EUR/USD)

  • Last Post
  •  
  • 1 510511Page 512513514 605
  • 1 Page 512 605
  •  
  • Post #10,221
  • Quote
  • Jun 9, 2019 3:25pm Jun 9, 2019 3:25pm
  •  skippyone
  • Joined Jun 2018 | Status: Member | 253 Posts
-Greetings Astro and cycles team

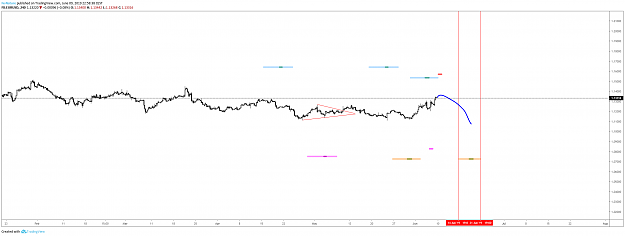
My EURUSD analysis for the coming week 10/06/2019 using timing solutions software
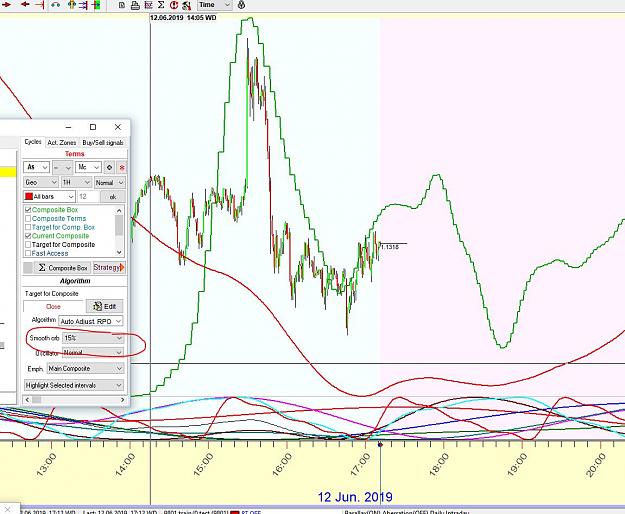
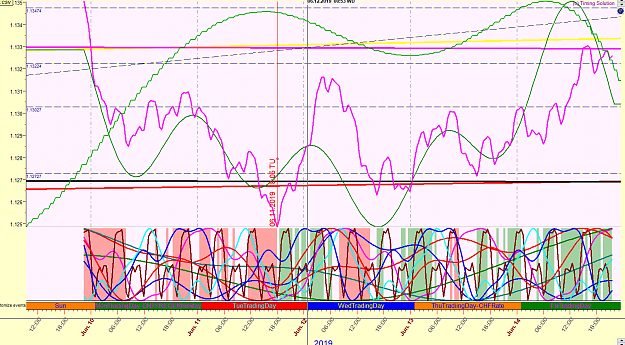
Cycle Parameters

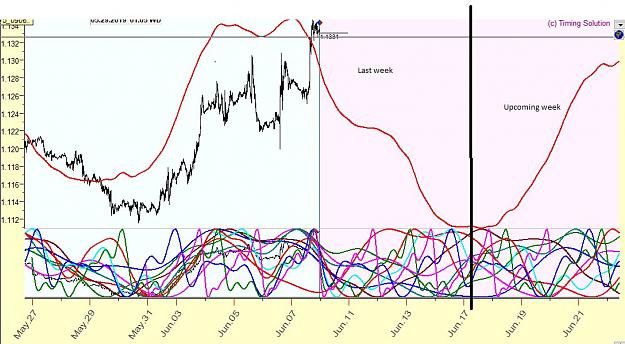
The Q spectrum tracked the trend well as evidenced by the rollercoaster of a ride. Down early in the week and closing on the highs.

Spectrum ( Red line )- 770 - did not track well
Spectrum ( Green line ) - 231 - tracked trend well
Q Spectrum - Composite - ( Pink Line ) 14,1926,78,159

Astrology :

Mars / Mars 7H - Tracked general trend ok

Weekly assessment

Well the week did not disappoint with the RBA and ECB reporting the current state of there economies. The Euro closed higher against the dollar at the end of the week due to some help from a weak NFP on Friday. Next week is pretty light on the calendar compared to last week so the political temperature may well lead the way.

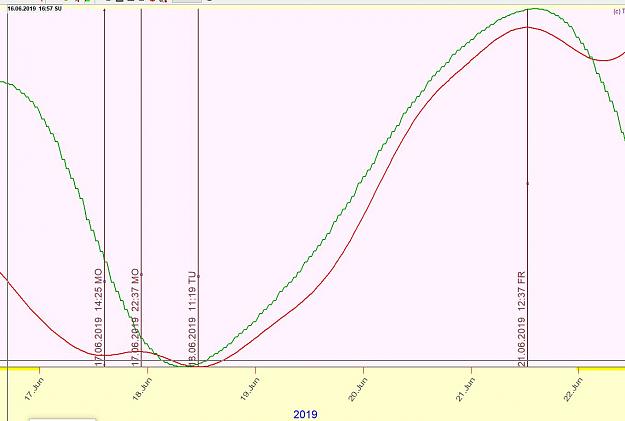
The cycle analysis is predicting a weak start to the weak with a mild recovery. The US inflation numbers might have something to say about whether the recovery will be mild.

Stay safe and Happy Trading - Update Thursday.

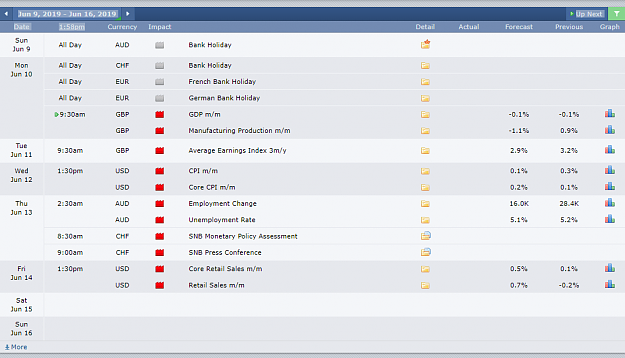
Other events to keep an eye on

Astrology Events

Plenty of aspects that may cause issues.

Geo-political / Fundamental impact

- Trump Tariffs - China talks
- Chinese Slowdown
- Any sizeable FX Option expiries
- Iran escalation
- UK Conservative leadership race
- CHF Rate announcement Thursday


Earnings calendar

Keep an eye on for general retail strength and consumer appetite.


Forex Expiries

Check Forex live for updates during the week


Events and Projections

1.Critical events 10/06/2019
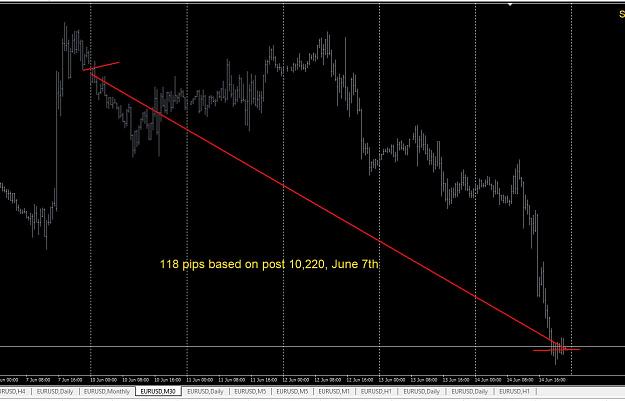
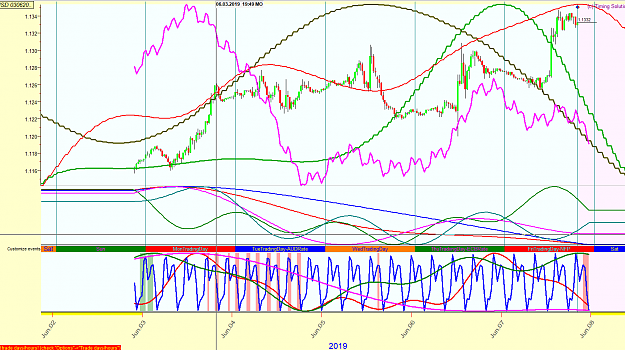
2.Final 03/06/2019
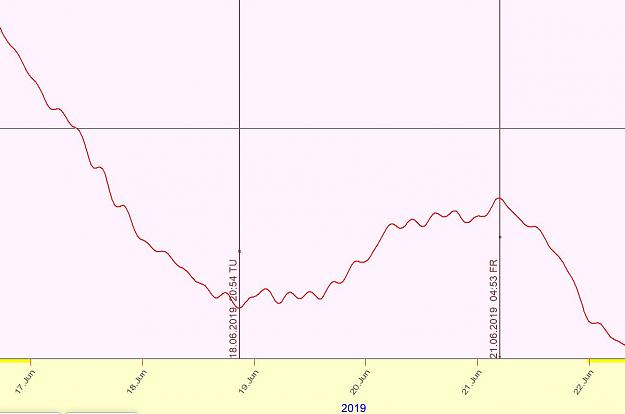
3.Projection 10/06/2019
Attached Images (click to enlarge)
Click to Enlarge

Name: Critical Events 10062019.png
Size: 38 KB Click to Enlarge

Name: EURUSD Final 03062019.png
Size: 122 KB Click to Enlarge

Name: EURUSD Projected 10062019.png
Size: 145 KB
1
  • Post #10,222
  • Quote
  • Jun 9, 2019 5:00pm Jun 9, 2019 5:00pm
  •  FxNature
  • | Joined Sep 2018 | Status: Member | 49 Posts
My outlook for incoming week, We shold be topping out on monday followed by weakness till the end of the week/first half of next week, with bottom around 19/20th of June. I am not sure we will see new lows or it will be just a retracement. Next week is fulled with crucial astro events so stay focused, since we have Trump's Solar return on these aspects.

Greetings.
Attached Image (click to enlarge)
Click to Enlarge

Name: 09.07.png
Size: 49 KB
  • Post #10,223
  • Quote
  • Jun 10, 2019 10:51am Jun 10, 2019 10:51am
  •  Dilmeshsingh
  • Joined Feb 2010 | Status: Member | 91 Posts
Hi,

I have been learning to use Timing Solution for the past few days.

One problem that I am facing is that when I use Astronomy module to draw cycle lines. TS is not showing cycle line projection in 15 min charts and below, when I use synodic (algorithm) with 15% (smooth orb). Why is it so?

Also, when smooth orb is reduced (like below 25%) I find the planetary cycle line is adjusted according to price. Line is not drawn independent of price. Is there some way that we can draw planetary cycle lines without its shape being influenced by price?

Plz, help, thanks.
  • Post #10,224
  • Quote
  • Jun 12, 2019 5:41am Jun 12, 2019 5:41am
  •  skippyone
  • Joined Jun 2018 | Status: Member | 253 Posts
Quoting Dilmeshsingh
Disliked
Hi, I have been learning to use Timing Solution for the past few days. One problem that I am facing is that when I use Astronomy module to draw cycle lines. TS is not showing cycle line projection in 15 min charts and below, when I use synodic (algorithm) with 15% (smooth orb). Why is it so? Also, when smooth orb is reduced (like below 25%) I find the planetary cycle line is adjusted according to price. Line is not drawn independent of price. Is there some way that we can draw planetary cycle lines without its shape being influenced by price? Plz,...
Ignored
if you have bought the version then user questions like this should be submitted to the user group where they will be answered. This is not a Timing solutions user forum. I use Timing solutions because in my experience it is the most advanced solution that incorporates technical and astro analysis.
  • Post #10,225
  • Quote
  • Jun 12, 2019 7:56am Jun 12, 2019 7:56am
  •  Dilmeshsingh
  • Joined Feb 2010 | Status: Member | 91 Posts
Quoting skippyone
Disliked
{quote} if you have bought the version then user questions like this should be submitted to the user group where they will be answered. This is not a Timing solutions user forum. I use Timing solutions because in my experience it is the most advanced solution that incorporates technical and astro analysis.
Ignored
Your answer tells me that you don't have the solution for the problem I just now mentioned. In the meant time, I have tried various combinations and I have found that TS draws the planetary cycle lines by adjusting it according to the price. That's why many lines are accurate in past analysis, but in projection they don't work.

Potential users should know the accuracy and performance of a software before paying a hefty price. Maybe you want me to go to their user forum, but I think people should know what are major flaws of this software.
  • Post #10,226
  • Quote
  • Jun 12, 2019 8:06am Jun 12, 2019 8:06am
  •  skippyone
  • Joined Jun 2018 | Status: Member | 253 Posts
Quoting Dilmeshsingh
Disliked
{quote} Your answer tells me that you don't have the solution for the problem I just now mentioned. In the meant time, I have tried various combinations and I have found that TS draws the planetary cycle lines by adjusting it according to the price. That's why many lines are accurate in past analysis, but in projection they don't work. Potential users should know the accuracy and performance of a software before paying a hefty price. Maybe you want me to go to their user forum, but I think people should know what are major flaws of this software....
Ignored
It only tells you that i don't use this functionality and it would be naive of me to tell you something about this part of the programme that i rarely use. To be clear there is no programme out there that doesn't have bugs and i would expect anyone who users computer software to understand this.

The user forum is supported by the programmer of the software and i regularly see updates to this software. If you have paid for the software you will know this and i expect to see your supposed outcome posted in the forum.
  • Post #10,227
  • Quote
  • Jun 12, 2019 9:17am Jun 12, 2019 9:17am
  •  Dilmeshsingh
  • Joined Feb 2010 | Status: Member | 91 Posts
Quoting skippyone
Disliked
{quote} It only tells you that i don't use this functionality and it would be naive of me to tell you something about this part of the programme that i rarely use. To be clear there is no programme out there that doesn't have bugs and i would expect anyone who users computer software to understand this. The user forum is supported by the programmer of the software and i regularly see updates to this software. If you have paid for the software you will know this and i expect to see your supposed outcome posted in the forum.
Ignored
I don't want to start an unnecessary argument, but I asked a question thinking that people are sharing their TS charts and someone might help me with my doubt. You said you haven't used this functionality, but you still commented without checking whether I was right or wrong. I understand that you were trying to guide me towards their user forum, but if you haven't understood already, then let me tell you that I haven't bought TS yet.

While checking this program I found this MAJOR flaw. Its not some bug in the operations, if its true, which it seems to be, then its a major issue.

Do one thing. For the same day, in the same instrument, use two different data sets. For eg., use 10th jun data for 11th jun in one data set and in other data set use 11th jun data for 11th jun. You will see that planetary cycle lines are drawn differently for the same day. It means that cycle lines are not drawn with the price, but according to it. If its true, which seems to be, then how can we be sure that the projection of the results of our past study can be trusted. Because a very important component of our past study, which is price, is not known for the future.

Obviously, TS must be working for your analysis, therefore, you are using it. But, I just shared my doubt. I think potential users should know what to expect before they pay huge amounts for this software. When I asked the questions, it was a doubt, but now I am quite sure that this is a major flaw of this software.
  • Post #10,228
  • Quote
  • Edited at 11:15am Jun 12, 2019 10:51am | Edited at 11:15am
  •  Sixer
  • Joined Nov 2008 | Status: Member | 1,757 Posts
skippy,

the discussion with DS is useless because he is using a cracked version from an indian guy which has a bug based on this crack.
Each user who has bought the original version would contact the developer of the software when he found a "major flaw" !

Sixer

Edit:
I also seriously doubt that the EURUSD cycles can be determined by the "planetary cycle lines" correctly.
  • Post #10,229
  • Quote
  • Jun 12, 2019 1:08pm Jun 12, 2019 1:08pm
  •  jnevins
  • Joined Feb 2007 | Status: Member | 2,098 Posts
Quoting Dilmeshsingh
Disliked
Hi, I have been learning to use Timing Solution for the past few days. One problem that I am facing is that when I use Astronomy module to draw cycle lines. TS is not showing cycle line projection in 15 min charts and below, when I use synodic (algorithm) with 15% (smooth orb). Why is it so? Also, when smooth orb is reduced (like below 25%) I find the planetary cycle line is adjusted according to price. Line is not drawn independent of price. Is there some way that we can draw planetary cycle lines without its shape being influenced by price? Plz,...
Ignored
Hello Dilmeshsingh,

I am not having this issue... the attached screenshot is of a 1 minute chart and using 15% smooth orb. I am using the June 9th, 2019 version of TS.

Green line is the astronomy module... red line is spectrum module.
Attached Image (click to enlarge)
Click to Enlarge

Name: Capture.JPG
Size: 157 KB
  • Post #10,230
  • Quote
  • Edited at 9:15am Jun 14, 2019 8:50am | Edited at 9:15am
  •  Dilmeshsingh
  • Joined Feb 2010 | Status: Member | 91 Posts
Quoting jnevins
Disliked
{quote} Hello Dilmeshsingh, I am not having this issue... the attached screenshot is of a 1 minute chart and using 15% smooth orb. I am using the June 9th, 2019 version of TS. Green line is the astronomy module... red line is spectrum module.
Ignored
Hi jnevins,

Thanks for addressing the actual question, but the problem in my charts is happening only with Sun, Jupiter, Saturn and Mars. The lines are not getting projected into future. I have found an easy solution to this problem, which is to add a few extra data to the chart and I can see how lines will be drawn into the future.

However, my real concern is that the lines drawn are highly influenced by price. Ideally, lines should be drawn with the price so that we can see them in the same frame. What I have realized that lines are adjusted according to the price movement and this can be misleading about the true accuracy of that line. In short, visual accuracy of the line is misleading when doing past analysis.

All you need to do is use two different data sets for the same instrument and for the same date, and planetary lines will be drawn differently. How can price change planetary lines so dramatically.

First problem, which I mentioned in my post10,223 can be a bug, I have no major problem with that; but the second problem which I found later (as I am still learning TS) is not a bug its a major flaw.

Thanks again for your reply.
  • Post #10,231
  • Quote
  • Jun 14, 2019 9:04am Jun 14, 2019 9:04am
  •  Dilmeshsingh
  • Joined Feb 2010 | Status: Member | 91 Posts
Quoting Sixer
Disliked
skippy, the discussion with DS is useless because he is using a cracked version from an indian guy which has a bug based on this crack. Each user who has bought the original version would contact the developer of the software when he found a "major flaw" ! Sixer Edit: I also seriously doubt that the EURUSD cycles can be determined by the "planetary cycle lines" correctly.
Ignored
My post where I mentioned "major flaw" was referring not to the issue of non-projection of the lines into the future, but improper adjustment of lines to satisfy price movement. I know the way I had written that post, both the issues seem to be linked, but they aren't.

Second problem wasn't mentioned in my first post as I had not observed it by that time. So the non-projection of the line can be a bug, but improper adjustment of lines to overstate their accuracy is a major flaw in the basic working of TS. And I am quite sure there is no use contacting the seller for that after money has been paid. That's why demo versions should be given, but now I know why the developer is not giving any demo or trials of TS.
  • Post #10,232
  • Quote
  • Jun 14, 2019 11:03am Jun 14, 2019 11:03am
  •  Dilmeshsingh
  • Joined Feb 2010 | Status: Member | 91 Posts
Quoting jnevins
Disliked
{quote} Hello Dilmeshsingh, I am not having this issue... the attached screenshot is of a 1 minute chart and using 15% smooth orb. I am using the June 9th, 2019 version of TS. Green line is the astronomy module... red line is spectrum module.
Ignored
Hi jnevins,

I went to your YouTube channel and saw some videos regarding the usage of TS. I have realized that I needed much larger data set with outer planets. Now, lines are projecting properly. Thanks very much for your videos. Please, keep posting them, they are really helpful for new users.
  • Post #10,233
  • Quote
  • Jun 14, 2019 3:33pm Jun 14, 2019 3:33pm
  •  jnevins
  • Joined Feb 2007 | Status: Member | 2,098 Posts
Quoting Dilmeshsingh
Disliked
{quote} Hi jnevins, I went to your YouTube channel and saw some videos regarding the usage of TS. I have realized that I needed much larger data set with outer planets. Now, lines are projecting properly. Thanks very much for your videos. Please, keep posting them, they are really helpful for new users.
Ignored

Glad to help... yes, I use 10,000 bars of data for most calculations.
  • Post #10,234
  • Quote
  • Jun 14, 2019 3:36pm Jun 14, 2019 3:36pm
  •  jnevins
  • Joined Feb 2007 | Status: Member | 2,098 Posts
Quoting Dilmeshsingh
Disliked
{quote} My post where I mentioned "major flaw" was referring not to the issue of non-projection of the lines into the future, but improper adjustment of lines to satisfy price movement. I know the way I had written that post, both the issues seem to be linked, but they aren't. Second problem wasn't mentioned in my first post as I had not observed it by that time. So the non-projection of the line can be a bug, but improper adjustment of lines to overstate their accuracy is a major flaw in the basic working of TS. And I am quite sure there is no...
Ignored

Yes, there is a free demo. The developer, Sergey Tarasov is very active on the user's group and answers questions/solves problems within a few hours.

Link to Demo: http://timingsolution.com/TS/Demo1a/
2
  • Post #10,235
  • Quote
  • Jun 14, 2019 3:40pm Jun 14, 2019 3:40pm
  •  jnevins
  • Joined Feb 2007 | Status: Member | 2,098 Posts
End of the week recap... done for the week... 118 pips based on post 10,220, June 7th.
Attached Image (click to enlarge)
Click to Enlarge

Name: Capture.JPG
Size: 99 KB
  • Post #10,236
  • Quote
  • Jun 14, 2019 5:17pm Jun 14, 2019 5:17pm
  •  chiche
  • | Joined Jul 2010 | Status: Member | 311 Posts
Quoting skippyone
Disliked
Thursday AM Update It has been an interesting week so far with USD weakness pushing the EURUSD market to intraweek highs on the back of a weak US ADP number. This was contradicted by a strong US ISM number yesterday which sold off the Euro. We still have some big news events out this week with the ECB press conference today. It will be interesting to see what the ECB can do. In recent weeks both the NZD and AUD have cut rates. The ECB has nowhere to go so more non standard monetary policy measures to stimulate an economy that has been on life support...
Ignored
Sorry, where did you find the option expirations?
  • Post #10,237
  • Quote
  • Edited Jun 15, 2019 10:47pm Jun 14, 2019 11:42pm | Edited Jun 15, 2019 10:47pm
  •  jnevins
  • Joined Feb 2007 | Status: Member | 2,098 Posts
Outlook for next week... We are heading into a week where the sun will be entering Cancer.... Forecasts seem to be more problematic around the time the sun enters a new house... It is also the summer Solstice! By Tuesday at the projected low, I should know if the curve is correct or if it needs to be inverted.

Red line= Spectrum, Green line=Uranus, 4th harmonic and in the clear this week.

When clicking on the "optimize" button in the Spectrum module, the 2nd image projection line emerged... Shows same curve but a bit time shiifted...
Attached Images (click to enlarge)
Click to Enlarge

Name: Capture.JPG
Size: 87 KB Click to Enlarge

Name: Capture1.JPG
Size: 57 KB
1
  • Post #10,238
  • Quote
  • Jun 15, 2019 8:45am Jun 15, 2019 8:45am
  •  becks.200
  • | Joined Jan 2018 | Status: Member | 424 Posts
Hi All,

Here is my version of Cycles for the next week.

The data is 15min - 15000 bars from last week, it does not include this week's data. I just want to check if we can predict using the same model for 2 weeks in row.
Attached Image (click to enlarge)
Click to Enlarge

Name: 2019-06-15 13.43.42.jpg
Size: 144 KB
  • Post #10,239
  • Quote
  • Jun 15, 2019 12:29pm Jun 15, 2019 12:29pm
  •  jnevins
  • Joined Feb 2007 | Status: Member | 2,098 Posts
Quoting becks.200
Disliked
Hi All, Here is my version of Cycles for the next week. The data is 15min - 15000 bars from last week, it does not include this week's data. I just want to check if we can predict using the same model for 2 weeks in row. {image}
Ignored

Looks good... great to have the extra input, Becks... Did you use the Spectrum module?
  • Post #10,240
  • Quote
  • Jun 15, 2019 1:00pm Jun 15, 2019 1:00pm
  •  Dilmeshsingh
  • Joined Feb 2010 | Status: Member | 91 Posts
Quoting jnevins
Disliked
{quote} Yes, there is a free demo. The developer, Sergey Tarasov is very active on the user's group and answers questions/solves problems within a few hours. Link to Demo: http://timingsolution.com/TS/Demo1a/
Ignored
Thanks, my mistake was not able to find this link on their website. You are truly helpful. Plz, continue sharing your insights about TS on YouTube also, like I said before, your videos are very informative .
  • Interactive Trading
  • /
  • Planetary Cycles Trading (EUR/USD)
  • Reply to Thread
    • 1 510511Page 512513514 605
    • 1 Page 512 605
1 member viewing:
wudenggan
  • More
Top of Page
  • Facebook
  • Twitter
About FF
  • Mission
  • Products
  • User Guide
  • Media Kit
  • Blog
  • Contact
FF Products
  • Forums
  • Trades
  • Calendar
  • News
  • Market
  • Brokers
  • Trade Explorer
FF Website
  • Homepage
  • Search
  • Members
  • Report a Bug
Follow FF
  • Facebook
  • Twitter

FF Sister Sites:

  • Metals Mine
  • Energy EXCH
  • Crypto Craft

Forex Factory® is a brand of Fair Economy, Inc.

Terms of Service / ©2021