technically should be short as we are under the 1hr, but it is in divergence with the 5, should be a good amount of pips however if it crosses the ema I could be wrong though...Its how I see it
Ignored
It went to m5 ema with DIV so i close my longs with some profits and open a short... not clear for me now but after visiting the ema in m5 and under h1 ema as u saying...price should make new low i guess right?
{quote} It went to m5 ema with DIV so i close my longs with some profits and open a short... not clear for me now but after visiting the ema in m5 and under h1 ema as u saying...price should make new low i guess right?
Ignored
Thats my understanding, if it fails to cross the 1 hr ema then new low, its stalled at the 5
life is a reflection of what we allow ourselves to see
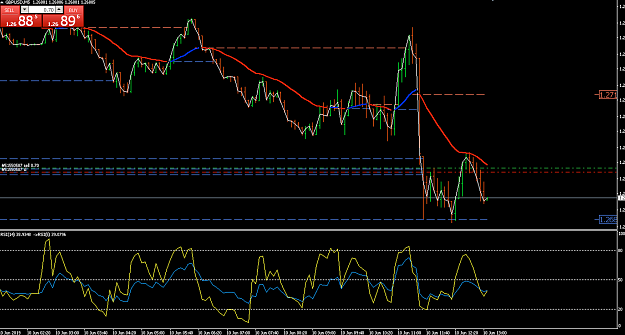
I just have the one short on which I took at the EMA, I think we should see a new low now and also on the hour as it looks like that divergence has failed
I could be wrong though
Attached Image (click to enlarge)
life is a reflection of what we allow ourselves to see
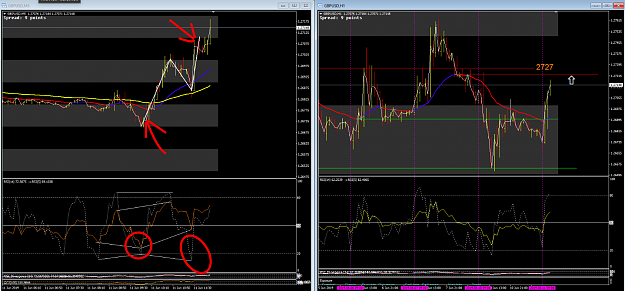
I just have the one short on which I took at the EMA, I think we should see a new low now and also on the hour as it looks like that divergence has failed I could be wrong though {image}
I just have the one short on which I took at the EMA, I think we should see a new low now and also on the hour as it looks like that divergence has failed I could be wrong though {image}
Ignored
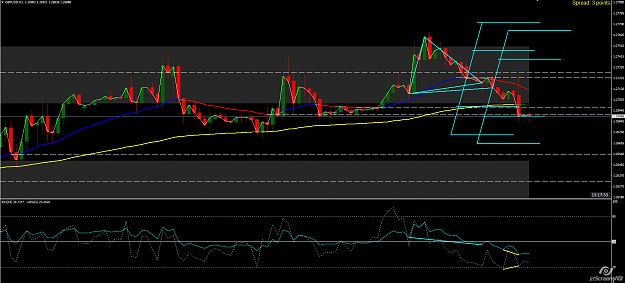
Looks like 50% of that ABCD H1 is holding meanwhile m5 looks like this...
This is why i took my longs(green)
Then at EMa closed and shorts(blue one)
And i think now again longs or hedge those shorts...(aqua)
Is it correct understanding or am I doing something wrong ?
{quote} Looks like 50% of that ABCD H1 is holding meanwhile m5 looks like this... This is why i took my longs(green) Then at EMa closed and shorts(blue one) And i think now again longs or hedge those shorts...(aqua) Is it correct understanding or am I doing something wrong ? thnks for helping {image}
Ignored
It looks like your doing everything very well, maybe just need to practice with moving your stops, I took the same longs as you did and then closed with that one short the same as you, Its always tricky around the EMA, but with time it gets much easier to see.
im not 100% sure on the blue divergence you have there, I'm sure Alan will shed some light on it tomorrow
life is a reflection of what we allow ourselves to see
Have been reading your post in the last weekend, thanks for your sharing, is a simple elegant yet effective system.
However, I have a question, hopefully is not too stupid.
In 5min chart, the fast RSI often moves very fast, and when we see it in the zone of 80 or 20, it is the time that we get ready to open trade, and when we see it makes a U turn, we open a trade (either the main one or hedge). The problem is, when the turn is made, often the fast RSI has already moved quite a distance, and hence the price, so is very difficult to enter at a good price, which also translates to a larger stop-loss.
How should I improve the exact entry point please?
{quote} Hi Nala66 Have been reading your post in the last weekend, thanks for your sharing, is a simple elegant yet effective system. However, I have a question, hopefully is not too stupid. In 5min chart, the fast RSI often moves very fast, and when we see it in the zone of 80 or 20, it is the time that we get ready to open trade, and when we see it makes a U turn, we open a trade (either the main one or hedge). The problem is, when the turn is made, often the fast RSI has already moved quite a distance, and hence the price, so is very difficult...
Ignored
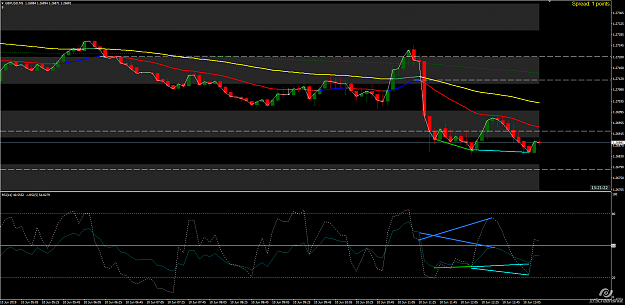
I don't think you have the idea quite correct here. If you look at the chart above (5m) you will see on these three occasions the RSI was in divergence with itself. Nothing whatsoever to do with speed, zone etc.
Almost every single day we have a similar setup i.e. Timing, Signal, Target.
See how now the 1 H hit the swing high average things start to get more erratic because as far as I am concerned the trade orders are done.
It is this initial run we look for our profits the rest may be considered as scalping. We have to be very careful because a scalp can easily turn into a run of sorts and stop us out repeatedly.
Not only that but it is chewing into our time where we could be doing something far more interesting.
{quote} Yes I understand your question. With a divergence we expect a return to the EMA and to even cross it and find support. In this case you are looking at bullish divergences going against the trend so in effect these are either scalps (which can turn into trades) or hedges to protect the short entries.. When the divergence fails to cross the EMA you should expect a lower low. When the bulls fail to find support expect a lower low. When the bulls cannot hold onto the support expect a lower low. Your assumptions were correct to go long but this...
Ignored
still going through your 'notes'
let say on H1 the price is below 26EMA for a long while, is there a point that where we may stop shorting and to go long to avoid/catch the potential reversal? Is it only done by trying? i.e. putting a hedge long trade and it then turns into our main trade and we close our initial short trade?
Also, why do you pick 26 for the EMA? is there any market psychological/behaviour reason? or 26 is just the best match for GBPUSD?
{quote} I don't think you have the idea quite correct here. If you look at the chart above (5m) you will see on these three occasions the RSI was in divergence with itself. Nothing whatsoever to do with speed, zone etc. Almost every single day we have a similar setup i.e. Timing, Signal, Target.
Ignored
Hopefully you can correct my thinking.
So in the attached, I have used two red arrows to show the entries, they are valid entries as far as RSI is concerned, after seeing RSI has made a U turn, it is likely to buy at the end (the high) of these candles and see a retracement of its own candle length.
How should keep my stop loss as tight as possible, or I enter at better price?
 Trading the Cable swings via averages