{quote} Weekly chart going to buy one below the big wick on weekly chart if it gets there. {image}
Ignored
Be a good time too start watching for a longer term hold ,, in the mean time its taking the pieces to get it there ,,,, may be some short term longs but tight stps and too even as soon as possible
{quote} Be a good time too start watching for a longer term hold ,, in the mean time its taking the pieces to get it there ,,,, may be some short term longs but tight stps and too even as soon as possible
Ignored
I’m just stating out it seems correlated with AUDJPY and it looks like it’s possibly going down a few hundred pips
{quote} Do you use harmonics? It looks like it could possibly be in early formation of bullish butterfly with buy being at 1.1070 area
Ignored
no ,, just levels and patterns ,, above below some shit lol,, not sure about harmonics never got into them ,,,, fib levels looked at them if one works hard enough one can make almost any level line up with something ,,, its where the line " yes those ratios found in everything ,,like the crops I grow but tht isint wht determines how they grow ,, its the shit tht affects the plant is what determines how they grow ,, mkts ,,, its whether a level is being bought or sold ,, dont matter if a fib level there or not ,, the fib levels I do watch tho are the 272 and 618 extensions of ranges ,,other than tht ,,,, a high a low and the 50 level
{quote} no ,, just levels and patterns ,, above below some shit lol,, not sure about harmonics never got into them ,,,, fib levels looked at them if one works hard enough one can make almost any level line up with something ,,, its where the line " yes those ratios found in everything ,,like the crops I grow but tht isint wht determines how they grow ,, its the shit tht affects the plant is what determines how they grow ,, mkts ,,, its whether a level is being bought or sold ,, dont matter if a fib level there or not ,, the fib levels I do watch...
Ignored
Well price found support at 78.6 fib point B for butterfly Thursday. And if it sells off around 1.1200 area which would be point C it’s possibly going to point D which is 1.1070 area. The thing I like about harmonics is they yield a very good risk to reward
Joined Jan 2010
|
Status: The Voodoo Boodoo Club
|42,055 Posts
whats next if tht 50 level gives out ,, also had the monthly 200 up there at the top of this ,, thts also around the 50 level of all the data you will see on most monthly charts of a eur tht you will open ,, lots of trading algo s set up using those extensions ,, wheres it going if thru fifty then to the low and tht lets go,,levels levels levels lol
Joined Jan 2010
|
Status: The Voodoo Boodoo Club
|42,055 Posts
circle looks like a blip on this chart ,,but tht is a 2 year blip lol ,,, long fucking time trading those weeklys back and forth but profitable just the same for those using levels
Joined Jan 2010
|
Status: The Voodoo Boodoo Club
|42,055 Posts
and if ya recall ,, the breakout happened when all calling for the eur to go to worthless because the big bad usd feds were rasing interest rates for the 1st time in years ,, why the damn eur was gonna be worthless hell fall right out of the bottom of your monitor lol ,, not quite the way it worked out at the time,, the mkts response was to gap 100 pips on a weekend and get above daily 200 and do the complete opposite
circle looks like a blip on this chart ,,but tht is a 2 year blip lol ,,, long fucking time trading those weeklys back and forth but profitable just the same for those using levels
Ignored
I bet a lot of people would be surprised to see it below 1.100 seems most people think it’s going up
{quote} I bet a lot of people would be surprised to see it below 1.100 seems most people think it’s going up
Ignored
never changes bud never ,, calls for 1.40 and the moon al the way up and even more so when it started down ,,, just like basement was called for at the bottom ,,, never changes lol all will be right evetentually ,, but the part tht pays is rolling with the mkt as it rolls along,,,, not the way one thinks in their own mind ,, but the way the charts tell ya,, and ya a lot of people will be but have to get the pieces to get it there ,,, weekly 200 floating around just above current levels ,, its below it ,, but it has to keep it below it ,, and with tht fifty level of tht range back yonder and this also being the shoulder level from back yonder ,,just an excruciating slow and pian in the ass level to trade atm ,, need tht fat finger to get shit rolling again lol,,in the mean time ,, weekly levels paying ya well and it slowly ever so slwly getting drove down
{quote} never changes bud never ,, calls for 1.40 and the moon al the way up and even more so when it started down ,,, just like basement was called for at the bottom ,,, never changes lol all will be right evetentually ,, but the part tht pays is rolling with the mkt as it rolls along,,,, not the way one thinks in their own mind ,, but the way the charts tell ya
Ignored
Doi you use a system? Yes the charts tell all. I just have a feeling that there’s a lot of longs and this will push it lower but looking for longs at 1.1070 if it gets there due to butterfly. I’ve gotten 10 times my risk with some harmonic set ups could have gotten more if I had let it run
Joined Jan 2010
|
Status: The Voodoo Boodoo Club
|42,055 Posts
sure many still trying to forget tht whole week but the picture from then ,, shts probably pretty confident on mkt close Friday ,, Monday at mkt open ,, not so much
Bro Oc6oph wish you good luck, on friday you linked with me and I replied in thread eurousdonly. I ended my trade with loss as you have seen. After that I read your some post and felt you are not easy.Perhaps my presentation may give you some sigh of relief.
I do not know your financial strength and I do not want to know. But it is my humble advice to the traders never never never open more than one lot and close that by the end of day or earlier either loss or profit unless the trader has $ 100k account.
Below are some graphs,black line is EMA5 and other indicators are very clear.
Just see when EMA5 cross Middle BB and MACD cross at the same time what happens.This stratigy is valid for every SYMBOL.
{quote} Doi you use a system? Yes the charts tell all. I just have a feeling that there’s a lot of longs and this will push it lower but looking for longs at 1.1070 if it gets there due to butterfly. I’ve gotten 10 times my risk with some harmonic set ups could have gotten more if I had let it run
Ignored
lol,, sft method ,,systems dont work ,, they dont adjust for the here and now ,,, designed for closed environments ,,, the mkts are not tht ,, simple farmer trading lol,, tried all the expensive shit and all the normal trading jargon bullshit not just try it followed religiously the way the rules stated ,,,, no where near getting anything close to what the mkt offers in terms of wht one can make,, the simpler one made it ,,the better one did ,, all the stuff I post is pretty much it ,,each ave has a distinct meaning along with the important time frame 200s ,, then some damn good levels,,,, then its just putting pieces together as stuff rolls along
Bro Oc6oph wish you good luck, on friday you linked with me and I replied in thread eurousdonly. I ended my trade with loss as you have seen. After that I read your some post and felt you are not easy.Perhaps my presentation may give you some sigh of relief. I do not know your financial strength and I do not want to know. But it is my humble advice to the traders never never never open more than one lot and close that by the end of day or earlier either loss or profit unless the trader has $ 100k account. Below are some graphs,black line is EMA5...
Ignored
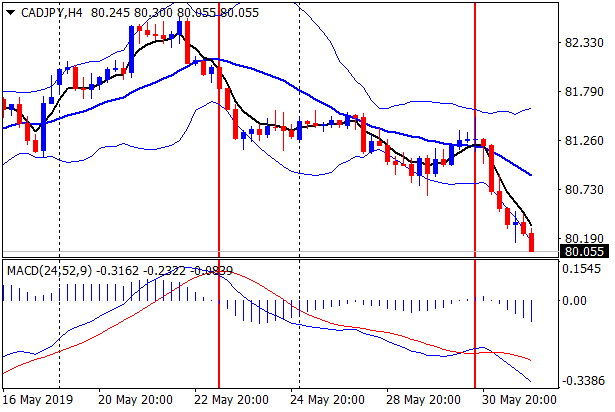
I’m not sure of moving averages I focus on fractal breaks on daily and H4. CADJPY had broken several H4 fractals and broke a daily fractal. I bought about 70 pips below the daily fractal break after it was broken.
{quote} I’m not sure of moving averages I focus on fractal breaks on daily and H4. CADJPY had broken several H4 fractals and broke a daily fractal. I bought about 70 pips below the daily fractal break after it was broken.
Ignored
nothing fancy ,, 24 on an hourly a rough daily price average or an m5 200 ,, weekly 7200 minutes divided by whtever time frame ya put it on ,, rough weekly average price ,,,, then the weekly levels to trade the quarterlies ,, weekly average matches up decent with the 8 hour stochs above below signal line some price patterns ,, just little tools to go with the levels ,, nothing fancy but damn effective ,,whole lot more so than some of the most expensive "real" trading bullshit crap I tried in the past ,, mkts are just sup and res thts it ,, and a reason to buy a level or sell a level ,, nothing else to think about
{quote} lol,, sft method ,,systems dont work ,, they dont adjust for the here and now ,,, designed for closed environments ,,, the mkts are not tht ,, simple farmer trading lol,, tried all the expensive shit and all the normal trading jargon bullshit not just try it followed religiously the way the rules stated ,,,, no where near getting anything close to what the mkt offers in terms of wht one can make,, the simpler one made it ,,the better one did ,, all the stuff I post is pretty much it ,,each ave has a distinct meaning along with the important...
Ignored
I use harmonics and trade fractal breaks on H4. I try to wait to take fractal breaks above 200sma to go short. After price closes below a fractal is best it seems. I had been trying some stuff on lower time frames for the last few weeks but it only resulted in losses.
{quote} I’m not sure of moving averages I focus on fractal breaks on daily and H4. CADJPY had broken several H4 fractals and broke a daily fractal. I bought about 70 pips below the daily fractal break after it was broken.
Ignored
OK Bro, if you have some time plz observe H4 and daily chart only.
Good wishes
{quote} nothing fancy ,, 24 on an hourly a rough daily price average or an m5 200 ,, weekly 7200 minutes deviding by whtever time frame ya put it on ,, rough weekly average price ,,,, then the weekly levels to trade the quarterlies ,, weekly average matches up decent with the 8 hour stochs above below signal line some price patterns ,, just little tools to go with the levels ,, nothing fancy but damn effective ,,whole lot more so than some of the most expensive "real" trading bullshit crap I tried in the past ,, mkts are just sup and res thts it...