Just updating some of our thought and analysis of the Forex markets from a global macro perspective and note how we’ve been playing them lately, analyze what our trading model identifies, and provide some thoughts on anything worth keeping an eye on.
EURUSD
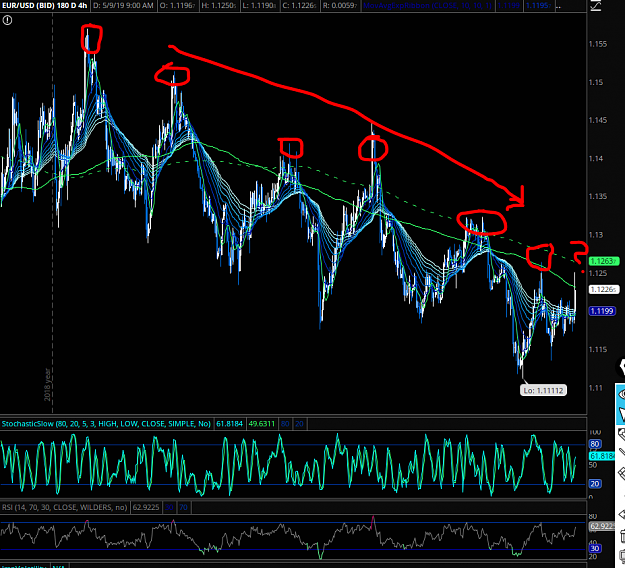
The weekly cycle has been flat-lining and may now look to start turning up. The daily cycle, which was down as of yesterday, may also look to be turning back up as well. The Daily chart below shows how the Euro has essentially gone sideways in a tight range for much of this year. Look at how well the peaks and valleys of the stochastic, which we use to follow our cycles, have tracked the ebb-and-flow price moves of this market.
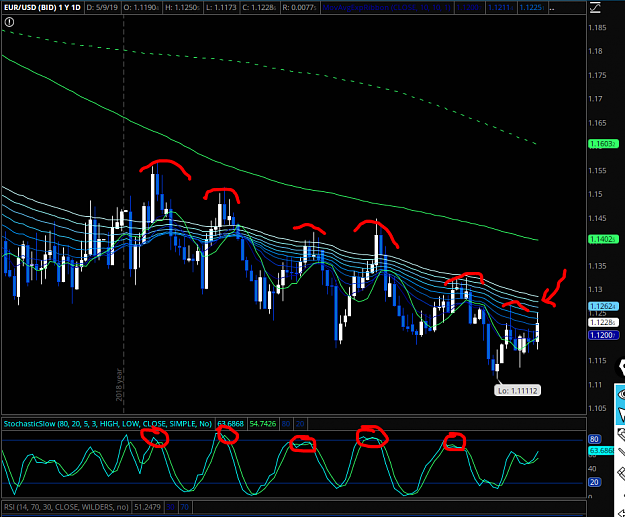
We’ll be watching to see if we get any significant moves or momentum through the summer and into the end of the year, but for now, the 4 Hour chart is showing there really isn’t much to do here with price contained to such a narrow range.
USDJPY
The Monthly chart of this pair shows a lot of sideways movement, generally speaking. The weekly cycle topped out as price rose to the 200-period moving average and failed. Now it’s turned down as price has dropped to the area of the 110 handle. We have been saying that this pair has been oscillating within a range roughly between 110-112, so it’s worth noting that it’s back down towards the bottom of that key range again in the big picture.
Drilling down to the Daily chart, we can see that price is revisiting the area around the last swing low and note the daily cycle is low.
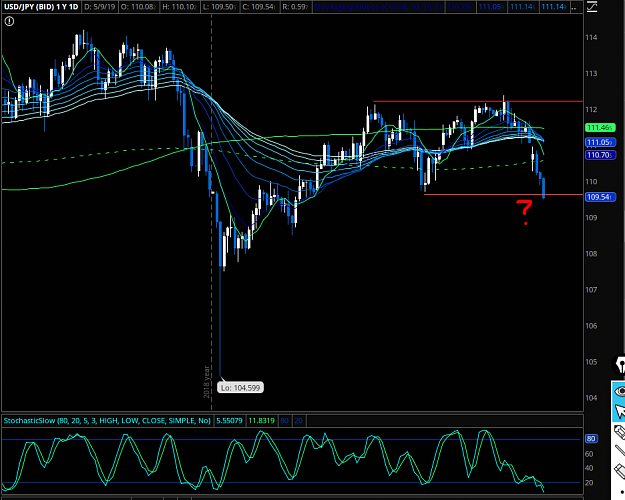
We’re watching to see if price can hold this area or not and I’m actually playing a very small core long here.
Since the Hourly chart clearly shows a series of lower highs and lower lows, indicative of a downtrend, we need to see that pattern change here in the near-term before considering adding more size to any long positions.
EURUSD
The weekly cycle has been flat-lining and may now look to start turning up. The daily cycle, which was down as of yesterday, may also look to be turning back up as well. The Daily chart below shows how the Euro has essentially gone sideways in a tight range for much of this year. Look at how well the peaks and valleys of the stochastic, which we use to follow our cycles, have tracked the ebb-and-flow price moves of this market.
Attached Image (click to enlarge)
We’ll be watching to see if we get any significant moves or momentum through the summer and into the end of the year, but for now, the 4 Hour chart is showing there really isn’t much to do here with price contained to such a narrow range.
Attached Image (click to enlarge)
USDJPY
The Monthly chart of this pair shows a lot of sideways movement, generally speaking. The weekly cycle topped out as price rose to the 200-period moving average and failed. Now it’s turned down as price has dropped to the area of the 110 handle. We have been saying that this pair has been oscillating within a range roughly between 110-112, so it’s worth noting that it’s back down towards the bottom of that key range again in the big picture.
Drilling down to the Daily chart, we can see that price is revisiting the area around the last swing low and note the daily cycle is low.
Attached Image (click to enlarge)
We’re watching to see if price can hold this area or not and I’m actually playing a very small core long here.
Since the Hourly chart clearly shows a series of lower highs and lower lows, indicative of a downtrend, we need to see that pattern change here in the near-term before considering adding more size to any long positions.