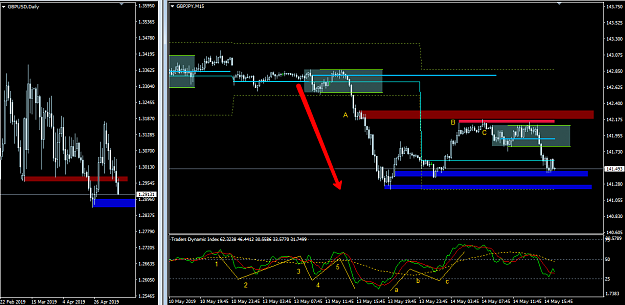
The big impulse move down broke the low of 9/10 May. It could be that price intend to move further down or it was an exhaustive move. we do not know.
The htf D1 shows that the strong resistance was broken and we still have room to move to the support. Price moves from one level to the next level. We do not know what are the levels the big boys set, but we can try to analyse. Same case as price moves from one trend line to the next trend line.
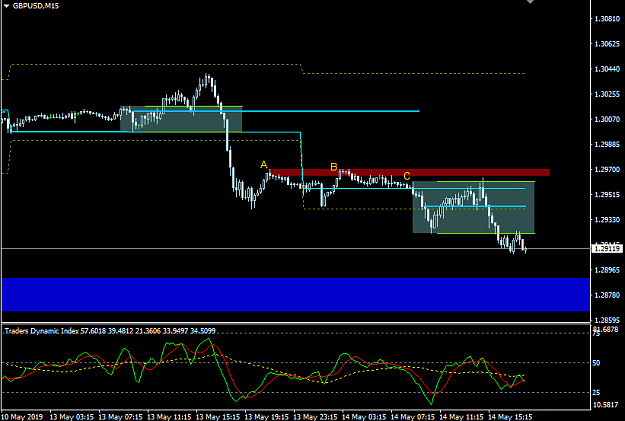
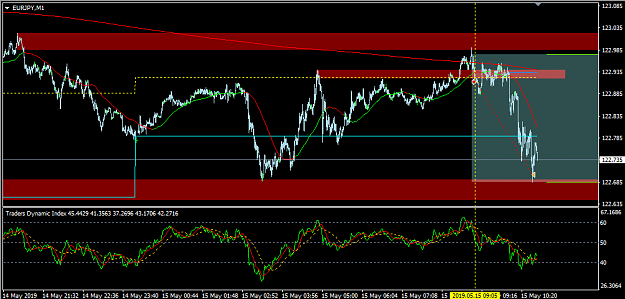
M15 at A we have a congestion zone which later set for price to retrace to.
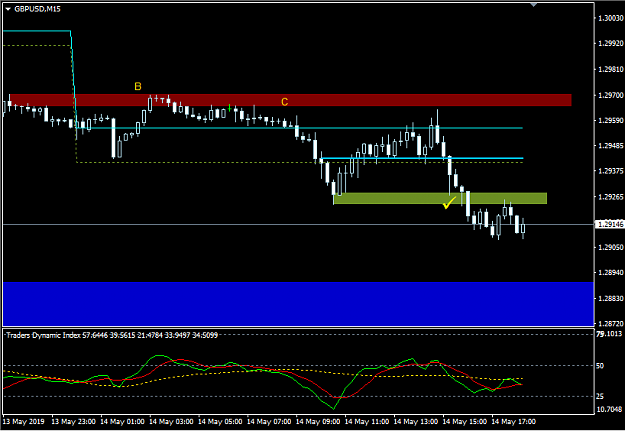
B was set to be Asia session high.
C when Frankfurt opened, price moved down not breaking the Asia session high.
Some time later when London opened, price reversed and moved up to Frankfurt open but still not breaking Asia session high.
This was an indication to me that the high of the day may have been reached.
Later price just sliced down after went passed London open looking for the day open, then to a support level.
All these are price levels.
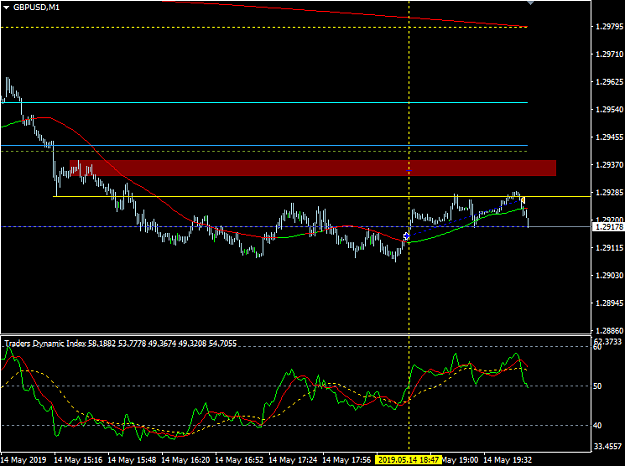
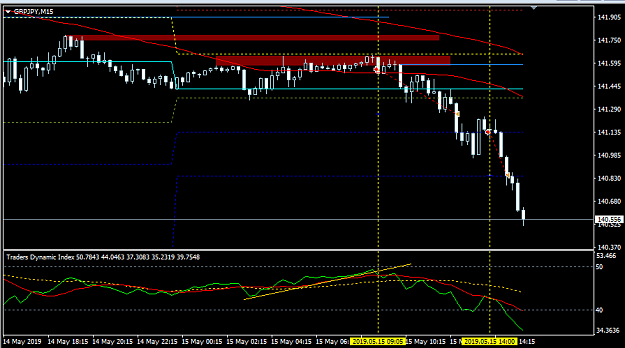
Waves counting. Count them in M15.
It's Elliot Waves but I never study them. What I know is that in a normal circumstance price moves in 5 or 7 up/down waves. Mega trend could even lasts 9,11,13 waves.
Then they have the abc retracement waves.
The waves are normally counted in the price chart but it's easier for me to see them in the RSI.
Start counting when the 34 SMA cross the 50 horizontal line. The RSI then weaves through the 34 SMA.
{quote} Thank you for your explanation. So to summarize: The main trend is determined in H1 by the slope of the 50 SMA Start counting the waves on M15 chart from when the 34 SMA crosses the 50 horizontal line Then only enter trades on wave #1 or wave #2 on either the M5 or the M15 chart
Ignored
yes that's right.
the 50 sma on h1 is applied to intraday trading. just like trend line on h1 (fxclassmate video).
we are trading pullbacks on entry time frames m15, m5.
the wave #3 can still be traded on discretion. but not on the wave #4.
they can similarly be applied to higher time frames. h4/d1 for medium term trend. w1/mn for longer term trend.
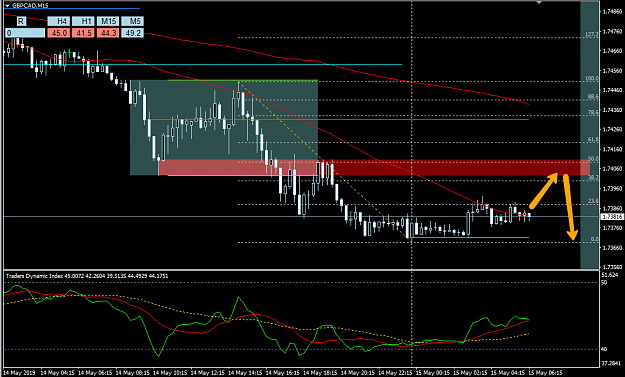
price could not get above asia session high.
1st entry - 2a 2b retracement entry.
2nd entry - 2a retracement entry.
both entries in direction of main trend.
The Usd pairs seem to have hit resistance and are just twitching back and forth a few pips.
I can't seem to get in anywhere on the M15 and M5 charts.
I guess all I can do it wait...
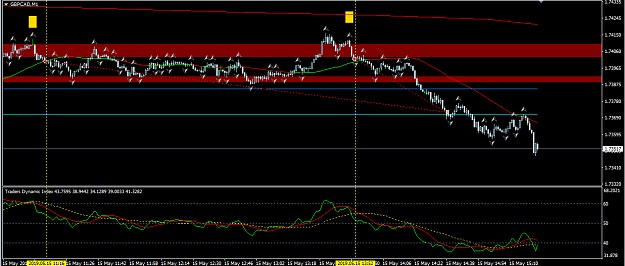
be aware of price levels.
if trading london session, take note of frankfurt open, london open, asia session high/low, previous day ny high/low (after london close), previous day london high/low.
they can be levels that price retrace to.
The Usd pairs seem to have hit resistance and are just twitching back and forth a few pips. I can't seem to get in anywhere on the M15 and M5 charts. I guess all I can do it wait...
Ignored
see whether usdcad m5 form a 3 brp. price just poked yesterday's high.
be aware of price levels. if trading london session, take note of frankfurt open, london open, asia session high/low, previous day ny high/low (after london close), previous day london high/low. they can be levels that price retrace to.
Ignored
Thanks, Inthebox.
Since I'm trading the New York session I'll take note of the high/low of the London, Asian and yesterday's New York.
{quote} Thanks, Inthebox. Since I'm trading the New York session I'll take note of the high/low of the London, Asian and yesterday's New York. Any other levels that you watch?
Ignored
and of course day open, previous day high low.
i have to say i find it easier to trade london than ny session. ny news is rather tricky.