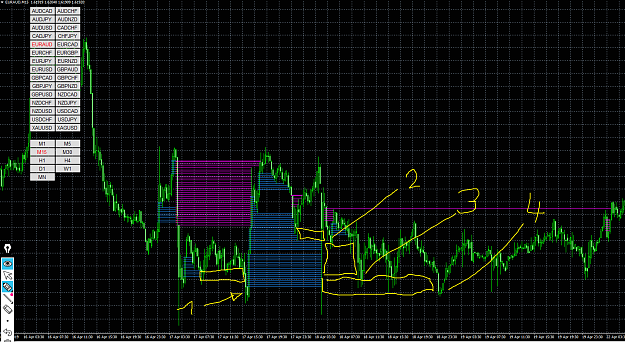
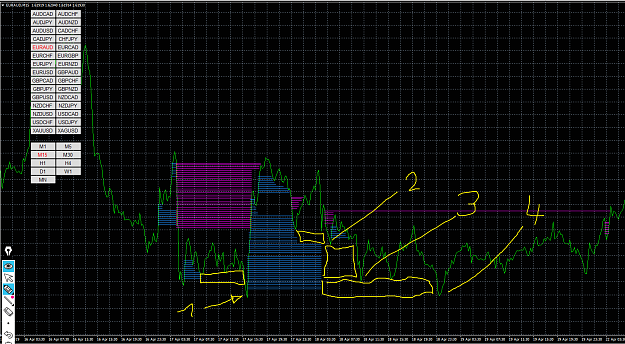
Disliked{quote} @pet3250 -- it looks like there are other targets, so it will be interesting to see how this goes. Since 'momentum' kept coming up in discussions, I am now incorporating it in my charts. Though I can now see targets (on both sides of the current price) I am still unsure which direction to go. Perhaps including momentum as a filter will help.Ignored
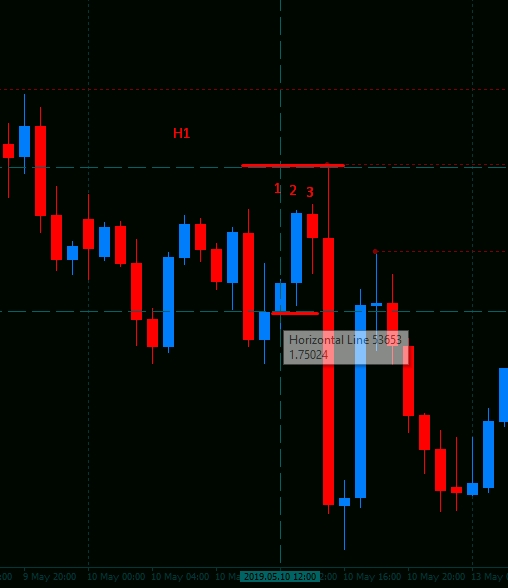
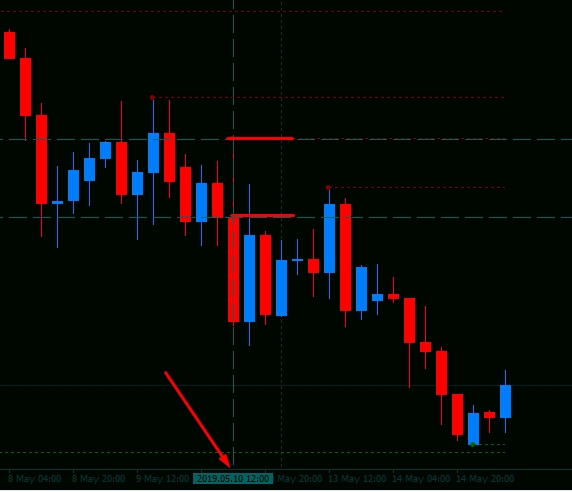
Obviously this will only work IF gaps ALWAYS get taken out.
Some people say I'm lucky, but the more I practice the luckier I get
1