Hey!
Thank you Alan for sharing your method.
Been studying the thread for a few days, currently on page 57.
Quick question on drawing divergences...
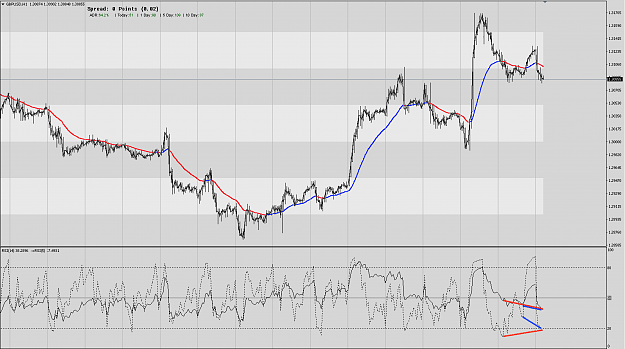
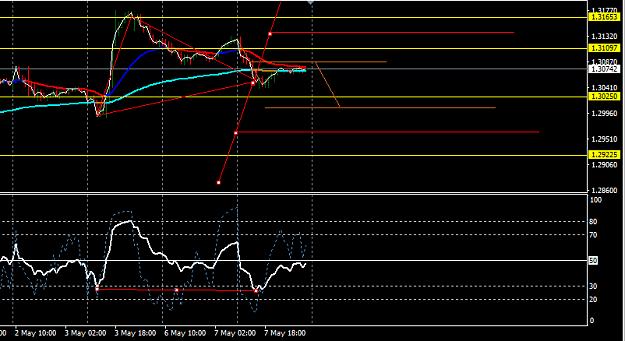
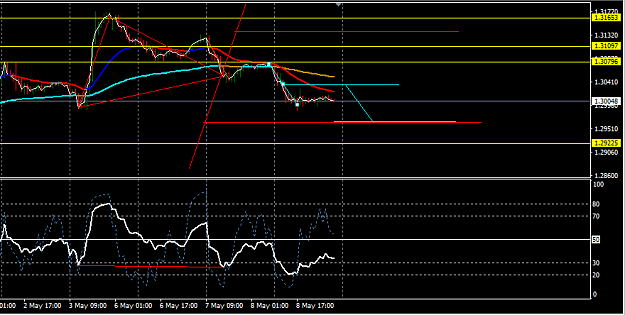
Currently on the attached H1 chart, I believe there's RSI-Div (red lines) but at the same time there wouldn't be divergence if I considered the blue lines.
While it seems obvious to use the last point in the chart to finish drawing the divergence, the starting point could be a little tricky.
Is there a rule for drawing the divergence which I am missing?
Thanks in advance for your input.
Thank you Alan for sharing your method.
Been studying the thread for a few days, currently on page 57.
Quick question on drawing divergences...
Currently on the attached H1 chart, I believe there's RSI-Div (red lines) but at the same time there wouldn't be divergence if I considered the blue lines.
While it seems obvious to use the last point in the chart to finish drawing the divergence, the starting point could be a little tricky.
Is there a rule for drawing the divergence which I am missing?
Thanks in advance for your input.
Attached Image (click to enlarge)