Disliked{quote} @TopCover -- nice chart and easy to read explanation -- thanks. So, how would you trade this? Since all this "dancing" occurs in the middle of the TMA then my inclination is to pass and wait for something simpler that doesn't require so much interpretation. @moodybot has mentioned this a number of times and it's the approach I'm currently using -- I'll wait for the price to re-enter my TMA. @moodybot explains this is where the MM shows his cards.
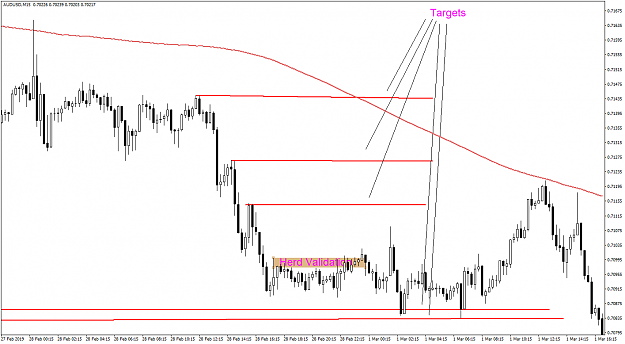
@RickM explained he uses the Line Chart analysis
not as his primary setup but, rather,...Ignored
Answer - I have sat in meetings with George and I can tell you he’s taking a trade every 5 minutes if he chooses just by following price action and he’s nailing those trades all night long. I am talking 200 pips in a couple of hours.
He is not just trading his spikes on the 1 minute chart but keeping his green pips turning over all night. That’s
because he’s a master of this game.
The reason I take trades using the line graph and trade off these optimised trend line on the candle close is to
continue my own studies on price action movement and to allow for a second source of trading income. It fills
by trading account with around 100 pips a day.
However I trade as my primary method George’s TMA method using his TMA one minute settings.
They are an incredibility precise and indeed more profitable than the line studies will ever become.
I also have no dog
Trading thin liquidity at the boundary of the charts
3