Thanks for the update and your dedication to creating free indicators mate, I'm looking forward to the MTF version.
Ignored
Quoting aaven
Disliked
Thanks Robots4me for sharing your hard work to the community
Ignored
@matthew89, @aaven -- thanks for the good word and letting me know. And as more people comment both with ideas and observations then I hope to make the indicator even more useful. I find this approach of trying to unravel the "psychology" of the MM most intriguing -- plus, it lends itself to an algorithmic solution.
I'm posting something that might shed some more light on the 5000 bars theory. These 2 screenshots show the indicator set to 4500 and 5000. See what a difference only 500 bars can make? Let alone if we go down to even a shorter number... Basically at this point in time we don't see any bottom on that TF. That of course doesn't go to state that I was right and you were wrong because a similar situation can happen with 5000 bars as well and off course we have higher TFs to back us up, but the point of this exercise is that we do need a certain amount of older data to pinpoint those targets, and cutting down the number of bars too much might make the indi pretty much useless compared to a manual drawing.
Ignored
@4fxonly -- good point and example. Okay -- I'll buy into the notion there will be situations where 5000 bars are necessary, but I'm not inclined to make that the default value. As @Nih98 pointed out, all you really need to know are the lines within close proximity of the current Ask/Bid. Let's say the goal is to have 3 alive TOPS and 3 alive BOTTOMS. How many bars will that require -- 500? 2000? 5000? It will vary by symbol, time frame, current market conditions, etc. So -- I was thinking of making the default something like 2000 bars. And in the bottom, right corner of the chart there would be buttons to increment or decrement the number of bars. In this way you could easily experiment with the number of bars to achieve the desired number of lines -- however many you desired. Do you know what I mean?
Good job.
Would it be possible to have, on the same graph, a button for each TF, in order to display at will the desired fractals of the TF. To the extent that it is feasible, and you judge its usefulness
{quote} @4fxonly -- good point and example. Okay -- I'll buy into the notion there will be situations where 5000 bars are necessary, but I'm not inclined to make that the default value. As @Nih98 pointed out, all you really need to know are the lines within close proximity of the current Ask/Bid. Let's say the goal is to have 3 alive TOPS and 3 alive BOTTOMS. How many bars will that require -- 500? 2000? 5000? It will vary by symbol, time frame, current market conditions, etc. So -- I was thinking of making the default something like 2000 bars....
Ignored
Thanks for the update. I understand what you mean and I will be happy to test it when it's ready to compare it to the way I'm used to see things right now. Keep up the good work, mate.
Would it be possible to have, on the same graph, a button for each TF, in order to display at will the desired fractals of the TF.
Ignored
@mchl13 -- nice idea. Yes -- that is possible.
Actually -- turns out there is a very nice "Dashboard" developed by @cja -- here's the link: https://www.forexfactory.com/showthread.php?t=519747
@cja's Symbol / TF dashboard is great -- I use it all the time. Rather than me adding a "mini-dashboard" to the MM Detective indicator, it makes more sense to simply drag @cja's dashboard onto the chart. And that way you can easily switch between TF's AND symbols.
{quote} @4fxonly -- you made a comment a few posts back (post #98) that I thought was interesting (a) because you stated it as given, and (b) I don't necessarily agree (at least not yet). You bring up an important issue that goes to the heart of why even bother using an indicator to mark-up charts if your eyes and brain are so superior. I'm curious to learn how others think of this -- hence, this post. For the moment, let's set aside the point that an indicator can do it faster. For the sake of argument, let's assume it takes the same amount of...
Ignored
Robots4me,
I wholeheartedly agree on the key elements: Making the job easier, Using the Same tool as MM (Using a Diamond to cut a diamond} and most importantly adapting to changing circumstances...
@Nih98 -- in post #130 you had responded to @heispark question of how to interpret the AUDJPY chart and you responded "Target Both". Do you mean you open hedging positions?
I had another question -- once you decide to focus on a particular target -- how do you exit? Do you set a TakeProfit close to the target price?
I recall @George saying he did not hedge. But he also intentionally didn't want to say anything more about how he traded. So, in trying to figure out how best to approach this methodology of focusing on MM targets then there is this gap in my understanding.
Or -- does anyone else have an approach they are willing to share?
...remember that more higher mean more expensive...
Ignored
@Nih98 -- in one of the charts you posted (post #96) you included the comment -- "remember that more higher mean more expensive". So, let's suppose there is an area of price consolidation and the herd density of TOPS and BOTTOMS are similar and approximately the same distance from the current Ask/Bid. Are you suggesting the MM is more likely to take out the BOTTOMS because it is less expensive for them? And why is it less expensive? Is it because they don't need to actually buy until after the transaction closes?
Joined May 2010
|
Status: Straight line Fest
|3,191 Posts
Hi all.
From my observation a target, even from H4, price may or may not stop and reverse after being broken... no better than a 50/50 call. More critical is to find a level that has been closely visited on more than one occasion that hasn’t been broken. Once it has been broken price action such as a TMA on a lower time frame can then be used as an entry. I would look to prioritise the search to find such levels.
I like the idea of the indicator though and wish you the best of luck.
I would look to prioritise the search to find such levels.
Ignored
Hello @moodybot -- this is excellent, thanks very much. I would have given your post 100 "likes", but unfortunately FF limited it to just one. Please let @George know he can derive much satisfaction knowing his methodology continues to spawn much interest.
May I make a suggestion here to possibly improve the MM lines?
Maybe only draw those lines from points that occur in higher volume trading times/sessions? Plus the larger pivots/turns
Those points likely represent places where there is higher volume for the MM to target.
This assumes that the lines drawn from points in lower volume times of day are probably much less attractive areas for MM to target.
{quote} Hello @moodybot -- this is excellent, thanks very much. I would have given your post 100 "likes", but unfortunately FF limited it to just one. Please let @George know he can derive much satisfaction knowing his methodology continues to spawn much interest.
Ignored
Hi. One like is good enough, lol.,,Georges methodology is sound. Very. But difficult to replicate via an EA or indicator, even unwise to. However, perhaps looking for 3 or more levels, unbroken but within a few pips span of each other could be highlighted in your indicator. It would be up to the individual to determine the gap but worth thinking about...
{quote} @Nih98 -- in post #130 you had responded to @heispark question of how to interpret the AUDJPY chart and you responded "Target Both".
(1). Do you mean you open hedging positions?
(2). I had another question -- once you decide to focus on a particular target -- how do you exit? Do you set a TakeProfit close to the target price? I recall @George saying he did not hedge. But he also intentionally didn't want to say anything more about how he traded. So, in trying to figure out how best to approach this methodology of focusing on MM targets then...
Ignored
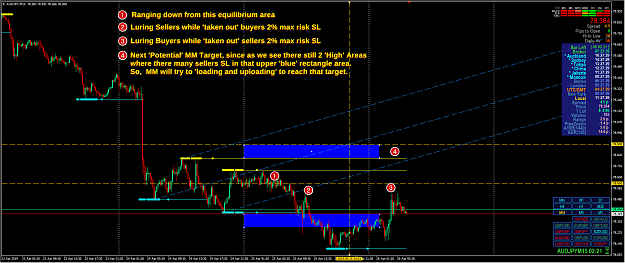
(1). No, not hedging positions just standard entry, depend on current situation, in that AUDJPY example there's ranging down candles configuration, meaning there's herd of Sellers and MM luring them more by moving down to bellow target area (under lower H4 3bars Fractal lines), and in exactly same time also 'taken out' SL of trapped buyers herd there.
(2). Hopefully by looking at this bellow picture and explanations, you could understand on how, when, where, and why you should entry or exit.
{quote} @Nih98 -- in one of the charts you posted (post #96) you included the comment -- "remember that more higher mean more expensive". So, let's suppose there is an area of price consolidation and the herd density of TOPS and BOTTOMS are similar and approximately the same distance from the current Ask/Bid. (1).Are you suggesting the MM is more likely to take out the BOTTOMS because it is less expensive for them? (2).And why is it less expensive? Is it because they don't need to actually buy until after the transaction closes?
Ignored
(1). Yup, that's why we frequently see that waterfalls (falling knives/spike down) more extreme and faster, compare to fountains (spike up). and also natural market psychology, where negative news/rumors will give bigger market impact because 'fear' always stronger than hope..lol.
(2). Exactly. and as we know mostly retail/herd mindset, love to bite that down momentum without think twice because they always think that current low is always the lowest low, and keep repeat that 'behavior' forever..lol.
May I make a suggestion here to possibly improve the MM lines?
Maybe only draw those lines from points that occur in higher volume trading times/sessions? Plus the larger pivots/turns
Those points likely represent places where there is higher volume for the MM to target.
This assumes that the lines drawn from points in lower volume times of day are probably much less attractive areas for MM to target.
Ignored
@silverau -- thanks for the suggestion. Yes, of course, I am open to new ideas and features -- but with one, important caveat -- I don't want to spend time coding everyone's ideas only to later discover they don't add much value.
If you could share screen shots that showed how your idea works -- that would be great. It would also make things more concrete and give me a better sense of how it could be incorporated into the existing indicator. Thanks...
Georges methodology is sound. Very. But difficult to replicate via an EA or indicator, even unwise to. However, perhaps looking for 3 or more levels, unbroken but within a few pips span of each other could be highlighted in your indicator. It would be up to the individual to determine the gap but worth thinking about...
Ignored
@moodybot -- thanks for your insight. One of the important things I came away with from @George's thread was a greater appreciation for discretionary trading. I haven't given up on thinking about an EA, but at this point I'm happy with an indicator that highlights certain features of the data that makes the discretionary part a bit less discretionary -- if you know what I mean. For example -- highlighting 3 or more unbroken levels is a great idea -- it is easy enough to implement and it focuses one's eyes (and brain) on that portion of the data that experienced traders like youself and @George tend to look for. And that helps the rest of us. @George always lectured about the need to spend thousands of hours of screen time for this stuff to sink in -- I'm an old fart and don't have 1000's of hours of screen time left. If things are going to click for me -- I need to make it happen sooner -- and algorithms are my friend.
No, not hedging positions just standard entry, depend on current situation,
Ignored
@Nih98 -- thank you for answering my question about hedging -- this helps me a lot.
Quoting Nih98
Disliked
Hopefully by looking at this bellow picture and explanations, you could understand on how, when, where, and why you should entry or exit.
Ignored
@Nih98 -- your screen shots and (1), (2), (3), (4) explanations are the best.
@Nih98 -- you should start your own thread. You are a natural teacher. You have a way of showing and describing that makes it easy for people to see and understand. And your written English is fine. People understand English is not your first language -- and because of the things they learn from you then grammatical errors are irrelevant and forgiven.
(1). Yup, that's why we frequently see that waterfalls (falling knives/spike down) more extreme and faster, compare to fountains (spike up). and also natural market psychology, where negative news/rumors will give bigger market impact because 'fear' always stronger than hope..lol.
(2). Exactly. and as we know mostly retail/herd mindset, love to bite that down momentum without think twice because they always think that current low is always the lowest low, and keep repeat that 'behavior' forever..lol.
Ignored
@Nih98 -- once again, great insight. Thanks for answering my questions. I'm learning a lot...