Hello!
I love using Bollinger Bands, so I keep thinking how to make use of it all the time.
I wanted to check out negatively correlated pairs and see how they react around top , mid and bottom bb.
Normally if one pair closes above top BB the other one should close at bottom bb and vice versa.
For example if you would look at EURUSD VS USDEUR than this would be true every single time, meaning that one would be above top BB and the other below bottom BB every single time.
So this would not help us traders at all.
Basically I am looking for divergence in the sense that when one pair is top BB the other one is at top BB as well. The closer they are to each other in price when it comes to BB lines the better.
I wanted to use 1hr tf so that I have enough signals and also enough meat to trade. I dont want 4 hr or more because of big SL. But you can try any tf you like.
The obvious choice was EURUSD VS USDCHF . However, I found that there wasnt enough pip value in 1hr. I mean its not bad but I found a better pair.
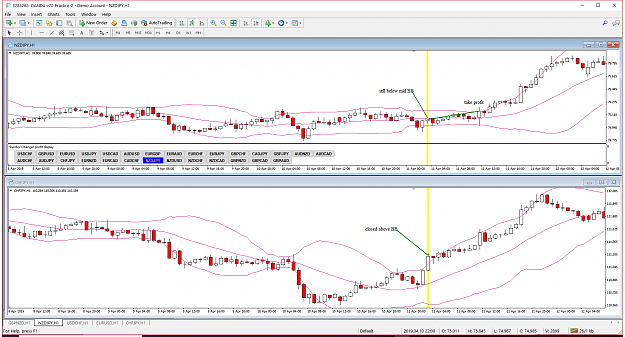
NZDJPY VS GBPNZD Feel free to find other pairs that work great.
Now for some reason I picked NZDJPY as the leading pair. I dont think this matters though, just go with the pair that breaks and closes top or bottom BB first.
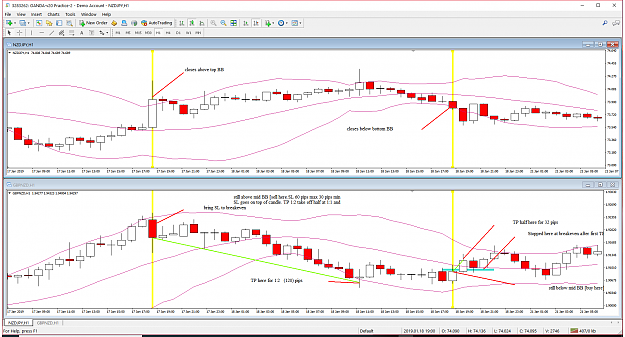
So I have a chart attached with 2 trades on it. Normally its not easy to find but they are quality signals.
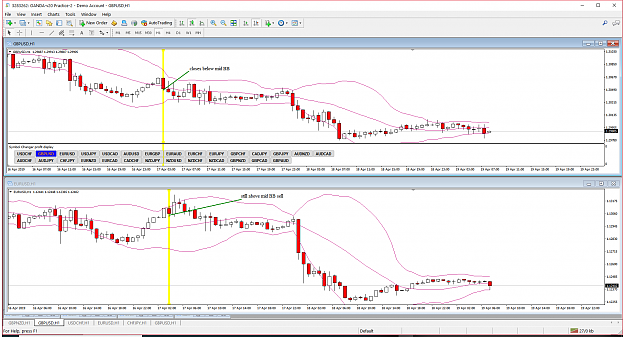
So in the chart you will see that NZDJPY breaks and closes top BB while GBPNZD is still above mid BB (since they are negatively correlated the GBPNZD should at least be close to bottom BB at this point. But its above mid BB so we take advantage of this) So we sell GBPNZD here hoping that it goes down to bottom BB like its suppose to.
Second trade NZDJPY CLOSES BOTTOM BB while GBPNZD is still below mid bb.
For stop loss in the case of GBPNZD I made a rule to use 60 pips as max(you can do what u want) and 30 pips min. So if the last low/high is bigger than max or smaller than min we go with max and min other wise we place sl at top/bottom of last high/low.
Take profit is 1:2 or 1:1 up to individual . I'm using 1:2 with breakeven at 1:1 with half taken off.
Other idea about TP is when the leading pair (NZDJPY) closes above, below or mid BB line we exit.
Let me know what you guys think and if you find any examples with other negatively correlated pairs please post your charts.
Thanks,
I love using Bollinger Bands, so I keep thinking how to make use of it all the time.
I wanted to check out negatively correlated pairs and see how they react around top , mid and bottom bb.
Normally if one pair closes above top BB the other one should close at bottom bb and vice versa.
For example if you would look at EURUSD VS USDEUR than this would be true every single time, meaning that one would be above top BB and the other below bottom BB every single time.
So this would not help us traders at all.
Basically I am looking for divergence in the sense that when one pair is top BB the other one is at top BB as well. The closer they are to each other in price when it comes to BB lines the better.
I wanted to use 1hr tf so that I have enough signals and also enough meat to trade. I dont want 4 hr or more because of big SL. But you can try any tf you like.
The obvious choice was EURUSD VS USDCHF . However, I found that there wasnt enough pip value in 1hr. I mean its not bad but I found a better pair.
NZDJPY VS GBPNZD Feel free to find other pairs that work great.
Now for some reason I picked NZDJPY as the leading pair. I dont think this matters though, just go with the pair that breaks and closes top or bottom BB first.
So I have a chart attached with 2 trades on it. Normally its not easy to find but they are quality signals.
So in the chart you will see that NZDJPY breaks and closes top BB while GBPNZD is still above mid BB (since they are negatively correlated the GBPNZD should at least be close to bottom BB at this point. But its above mid BB so we take advantage of this) So we sell GBPNZD here hoping that it goes down to bottom BB like its suppose to.
Second trade NZDJPY CLOSES BOTTOM BB while GBPNZD is still below mid bb.
For stop loss in the case of GBPNZD I made a rule to use 60 pips as max(you can do what u want) and 30 pips min. So if the last low/high is bigger than max or smaller than min we go with max and min other wise we place sl at top/bottom of last high/low.
Take profit is 1:2 or 1:1 up to individual . I'm using 1:2 with breakeven at 1:1 with half taken off.
Other idea about TP is when the leading pair (NZDJPY) closes above, below or mid BB line we exit.
Let me know what you guys think and if you find any examples with other negatively correlated pairs please post your charts.
Thanks,
Attached Image (click to enlarge)