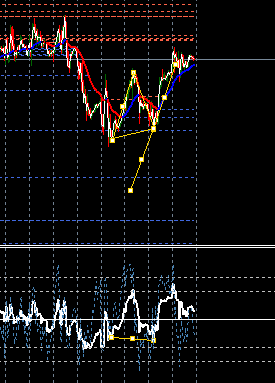
Have also question if ABCD patterns exist in the charts below. (in the 1st one the divergence is clear, just asking for the ABCD pattern if it is correctly drawn. {image} {image}
Ignored
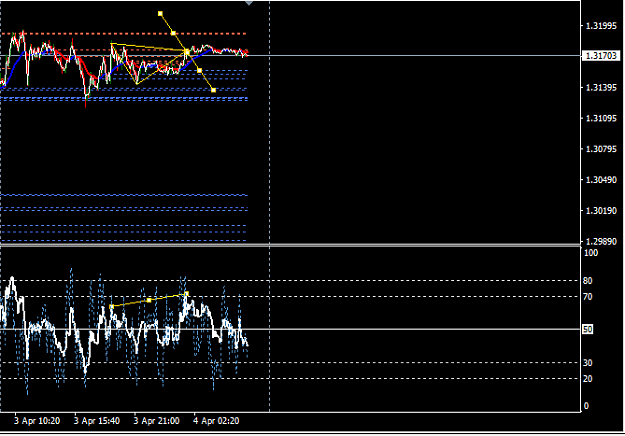
I don't know what your first chart is all about.
On the second chart you have completely missed the Continuation Div
If you guys insist on keep drawing sloping lines to connect the pivots you will be wrong most of the time.
Look where C is on the RSI and look where C on the price (Aqua level) Between the two vertical lines
On the larger ABCD this happened after the first target was hit and pushed up to the 50% level.
{quote} I don't know what your first chart is all about. On the second chart you have completely missed the Continuation Div If you guys insist on keep drawing sloping lines to connect the pivots you will be wrong most of the time. Look where C is on the RSI and look where C on the price (Aqua level) Between the two vertical lines On the larger ABCD this happened after the first target was hit and pushed up to the 50% level. {image}
Ignored
As for the first chart, I am posting it again (it is more clear now as a graph), but I might see the mistake. For continuation upwards pattern you want ABCD with the triangle pointing up (and the opposite for the downwards continuation)? I must admit that by that moment I was looking for downward movement, but if I understand correct, for that moment (opposite to the main trend) only divergence should be drawn. [Even huge mistakes can lead to learn the correct ones , Now i might see the possible mistake!) -{ignore ABC letters in the graph, are used in the 2nd one}
The big one (ABCD) is wrong because the B wasn't attacked by C?, thus cannot be continuation?
Edit: we had the small ABCD you drawn above and market hit the target, shouldn't we continue? On your example on the 3rd chart, market hit D on the small triangle and then you continue with a large one?
The continuation is the most recent swing? Thus the picture below (graph 2) cannot be continuation pattern, even if swing is being attacked? (erase the price activity after C-suppose we don't have enough candles after that)
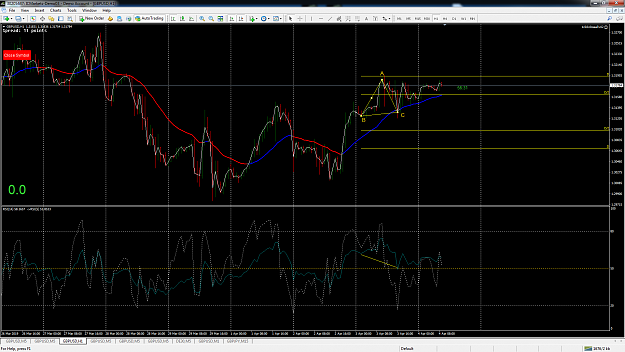
The 4H chart looks to me like it is all drawn correctly. HOWEVER this is a 4 hour chart and they vary quite a lot according to individual brokers closing the bars at different times. I don't trust this chart too much because of that reason alone.
Here are both mine and your charts side by side and they are totally different structures.
Look at where mine found bull support and then overnight retested it. Your chart has none of that.
On the plus side you had that bull div at the bottom where I did not.
Crazy isn't it, how can we hope to make sense of 4 hour charts.
I am not at all bothered about what shape or form the market makes over the course of the 24 hour period.
For me my task is to make my 40 pips at the appropriate time and within a reasonable space of time. This is an efficient use of my time.
I don't care if the price moves 100's of pips, I am not sitting here day after day waiting for that to happen when I can get my 40 just about everyday in a short space of time.
I start to look for work around bar 108 on the 5 min chart which says 0900 on the chart. I don't move it because of time differences, it stays the same always.
Starting work for me means looking at the averages and trying to work out the most likely direction. Then looking for signals to take me in that direction. If I am wrong the signal will fail and I will be stopped out usually for BE and then I can change my direction if need be.
So right time and place, signal, target, result, done and dusted. All the other stuff is just other stuff.
The reason for this other stuff is because many will not trust in the money management so they go off on a tangent with risk/reward, percentages and such hoping to milk every pip from the market. I too have done all this risk 1% to get 2% stuff and how many traders do that and fail I shudder to think. I have sat for days trying to get back just to BE on trades wasting a lot of time and carrying all the stress related to that and for nothing.
There is not much I haven't tried over the years and from that have gained a huge amount of experience. Now I have put all that experience into one package that works well for me. At a glance I can see a signal and I also know the risk but more importantly accept that risk. This is because I have faith in what I do and that faith only comes from experience.
I can't teach people to trade, there are so many variables. All I can do is show the key points I am interested in to make the profit I require.
Others may say they trade such and such, well that is just of a passing interest to me. My trading is so regimented it is actually boring, just a job to be done each day.
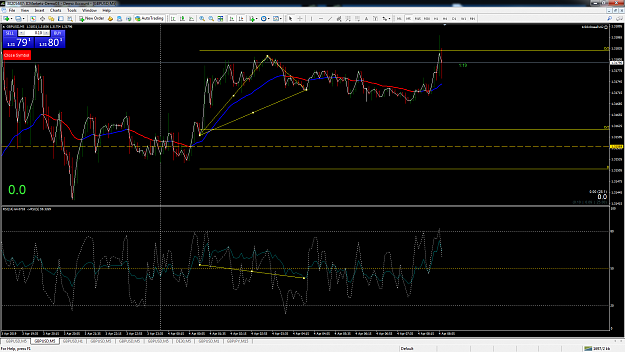
4H, 1H both above EMA but we had bearish RSI div on 4H that hasn't returned to ema yet. Looking at 1.31773 on 1H for possible bearish HD in which case I'll look to short on 5m.
{quote} The 4H chart looks to me like it is all drawn correctly. HOWEVER this is a 4 hour chart and they vary quite a lot according to individual brokers closing the bars at different times. I don't trust this chart too much because of that reason alone. Here are both mine and your charts side by side and they are totally different structures. Look at where mine found bull support and then overnight retested it. Your chart has none of that. On the plus side you had that bull div at the bottom where I did not. Crazy isn't it, how can we hope to make...
Ignored
Good morning (evening in your time) Alan. It is like your because it is an very old one chart of yours (have multiple of them downloaded in order to study them). Don't be "alarmed", I am not in the position to spot ABCD patterns so easily.
I post it as an example since I could not understand why my "big" triangle in a picture posted was wrong. (PS I don't say I am correct, I am trying to understand the wrong)
4H, 1H both above EMA but we had bearish RSI div on 4H that hasn't returned to ema yet. Looking at 1.31773 on 1H for possible bearish HD in which case I'll look to short on 5m.
Ignored
Great you post this, brave and helpful and thanks.
H1 made that HD.
but there is only room for 20 pips maximum to its EMA, which is making HH & HL
{quote} Great you post this, brave and helpful and thanks. H1 made that HD. but there is only room for 20 pips maximum to its EMA, which is making HH & HL
Ignored
All true but I have an ABCD (1h) that has lower targets. Shorted at 3183 upon regular div on 5m. Will look to hedge when appropriate.
I am glad because I was watching the same trade at 1.3178 (wanted the breakout). The trigger was the bull support in 5min chart (plus off course that 1h is still long)?