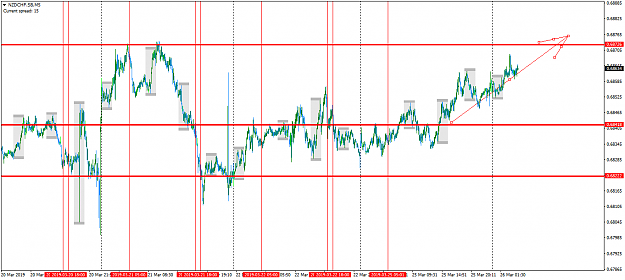
Even though I can see a valid buy signal, the market decided to go into a range. This is one of those trades you just need to be sure of your calculation and be patient till your tp is hit.
{quote} What do the blue circled vertical lines mean, is it the end of one period and start of the next monitored period? {image}
Ignored
Yes, they are the time of new signals coming up....check the lowest price level of the previous days during those time kept maintained therefore you will be looking to buy after the second day.
{quote} here is the grey area files...you can exclude the rest, the empty your chart is the better :-) {file}
Ignored
Cool thanks mate, ah its MT4 been using MT5, will try and locate MT4 as well. Appears to be more scripts around for MT4.
Your right about the empty chart, I used to have everything on there MACD, RSI, Squeeze etc, didnt really help me much. Learning more about the cloud, but I do like FIBS I always tend to use them.
{quote} Cool thanks mate, ah its MT4 been using MT5, will try and locate MT4 as well. Appears to be more scripts around for MT4. Your right about the empty chart, I used to have everything on there MACD, RSI, Squeeze etc, didnt really help me much. Although I do like FIBS and learning more about the cloud.
Ignored
Don't bother too much about the script if it will take too much of your time...it takes less than a minute to put them down...but obviously if you are back testing it will take more time, you are right :-)