Hi Alan, I want to get an indicator made for the supports and resistances and have drawn up the pivot and wick combinations that I think forms them. Can you tell me if they are correct or if I have missed any please?
Hi all,
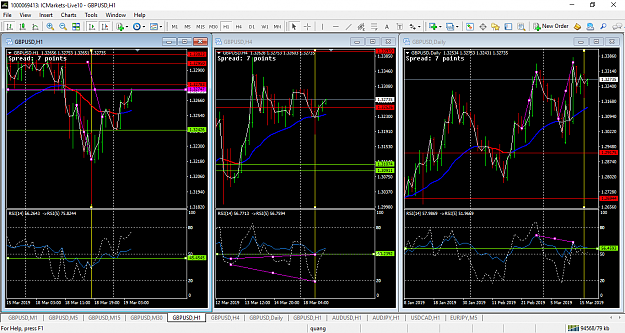
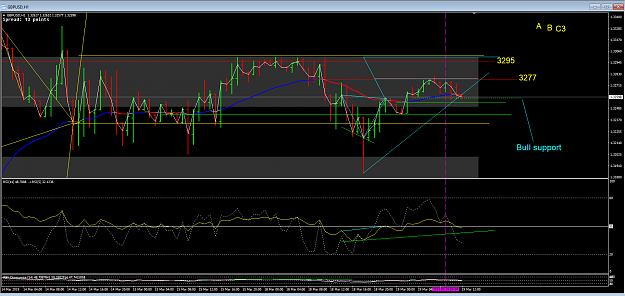
What I am seeing is GU playing between a range formed by previous bear support and current bull support. My plan is waiting until either way broke.
Please share your insights so we all can learn together
Hi all, What I am seeing is GU playing between a range formed by previous bear support and current bull support. My plan is waiting until either way broke. Please share your insights so we all can learn together
Ignored
I have already sell it. SL 15 pips. But bear need H1 close below 1.32600.
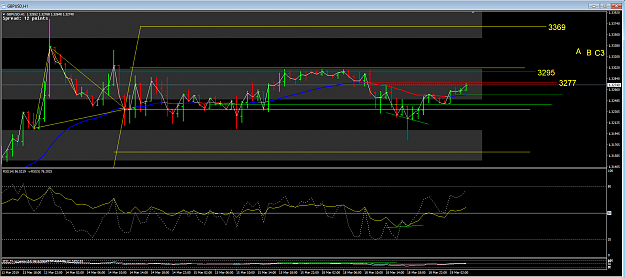
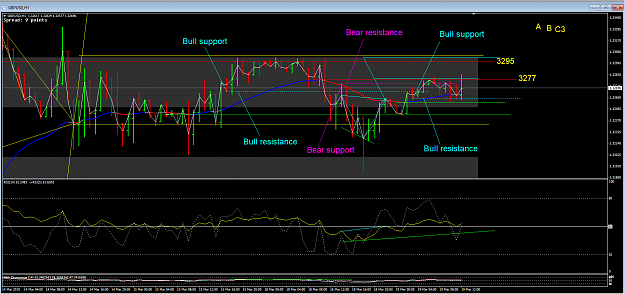
Hi Alan, I want to get an indicator made for the supports and resistances and have drawn up the pivot and wick combinations that I think forms them. Can you tell me if they are correct or if I have missed any please? {image} {image} {image} {image} {image}
Ignored
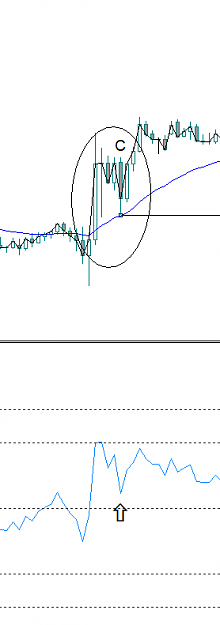
I see C as being incorrect because of the previous pivot. This was the one that attempted to find bull support but as you see the bears stripped them of it by closing below it.
A support either bullish or bearish ends its life if it is broken by a closing cross. Price may cross it and not end it because it has to actually be a close.
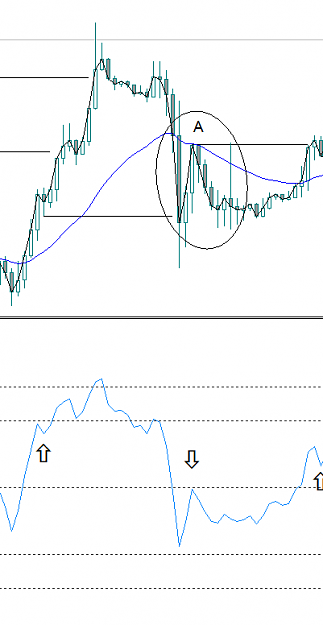
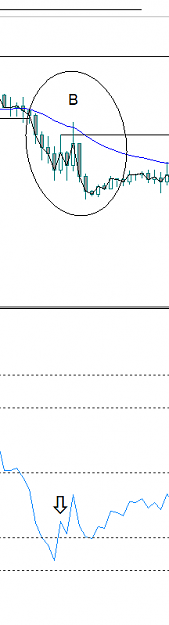
On the 1 hour chart below we see the bears have crossed the bull support but have not yet broken it by closing across.
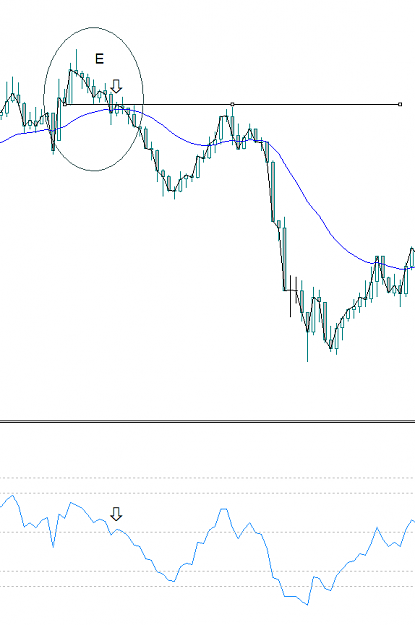
Also E is completely wrong, the bears can't possibly find support above the EMA. What you have there is a previous bull support the underside of which is resistance.
{quote} I see C as being incorrect because of the previous pivot. This was the one that attempted to find bull support but as you see the bears stripped them of it by closing below it. A support either bullish or bearish ends its life if it is broken by a closing cross. Price may cross it and not end it because it has to actually be a close. On the 1 hour chart below we see the bears have crossed the bull support but have not yet broken it by closing across. {image}
Ignored
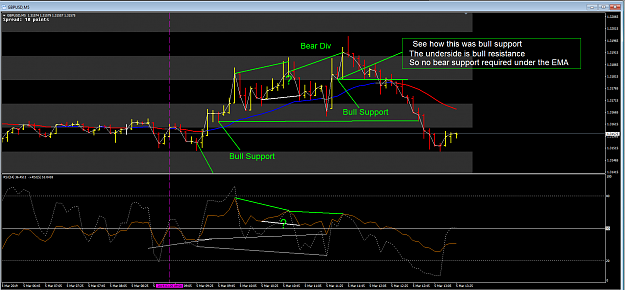
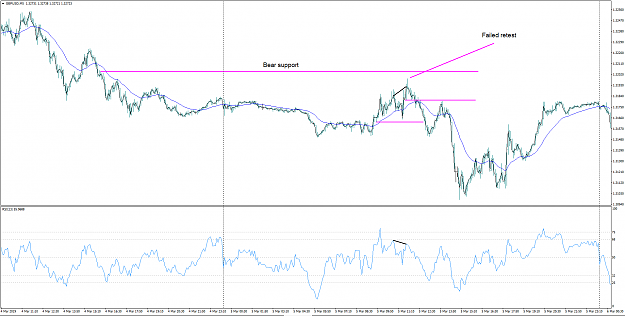
Ok so C and E are out. Thanks. With E you posted the chart below for March 5th for that support. Just wondering then in the chart below was that reference to the bear move because a bear support had already been put in the day before higher up. Then we were looking at the retest of that previous days support followed by the divergence to continuation the trend. Therefore no second bear support required to take out the bull support below?
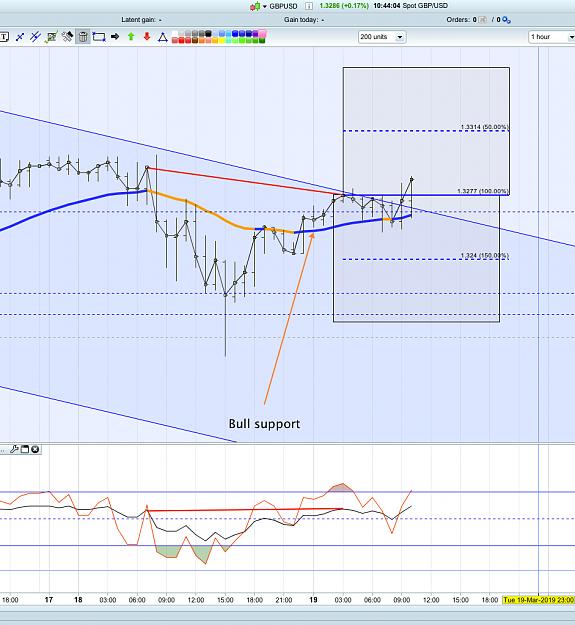
Again this is my take on the situation. We still have the upper target that Alan mentioned earlier. This is another interim move up. Bull support seems to have been found and I am setting my target at the 50% level for now. I will then wait and look for signals as to the next direction. My view only. It may or may not be right. Comments please.
{quote} Ok so C and E are out. Thanks. With E you posted the chart below for March 5th for that support. Just wondering then in the chart below was that reference to the bear move because a bear support had already been put in the day before higher up. Then we were looking at the retest of that previous days support followed by the divergence to continuation the trend. Therefore no second bear support required to take out the bull support below? {image} {image}
{quote} Yup, price keeps bumping between bull support and bear support. I bet we could get enough 40 pips by scalping each way up and down until now, lol :d
Ignored
There is no bear support the bulls took that out 8 hours ago