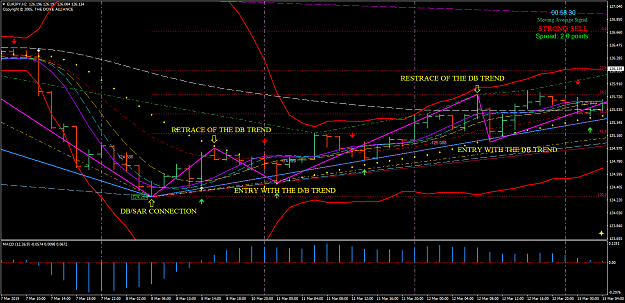
What is amazing is after the training I done a couple of weeks ago in how to use the DB/SAR with Divergences - not one of you had the courage showing the light of what you have learned. All you guys had done is watch this market move 241 pips in an uptrend; and then make excuses of not finding a trade. Well, let me show you what you had miss:
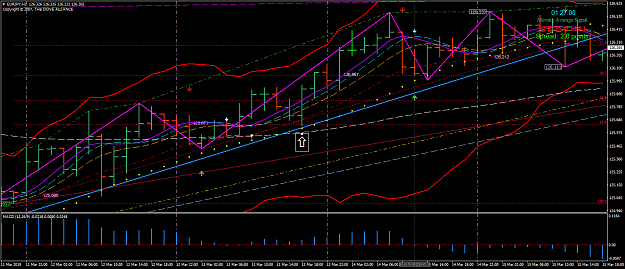
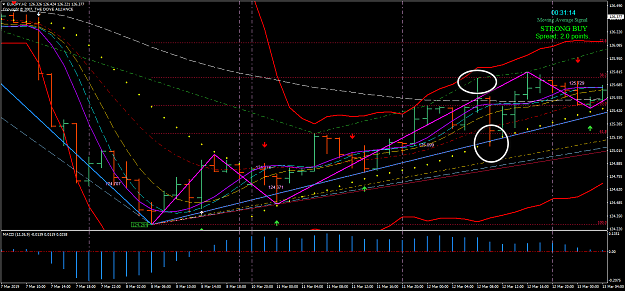
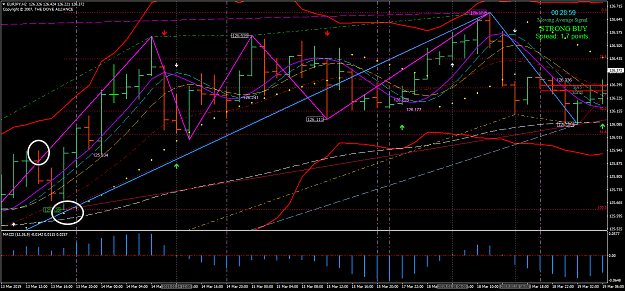
This screen shot is showing the beginning of the trend with the DB/SAR and Divergences.
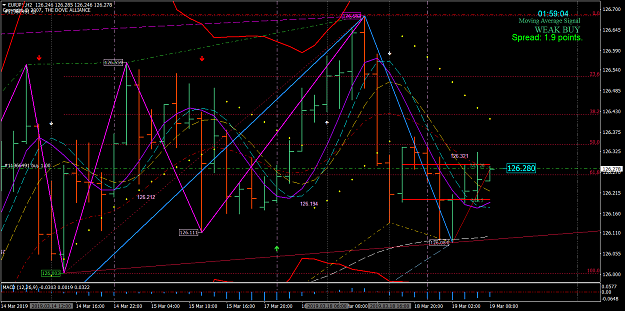
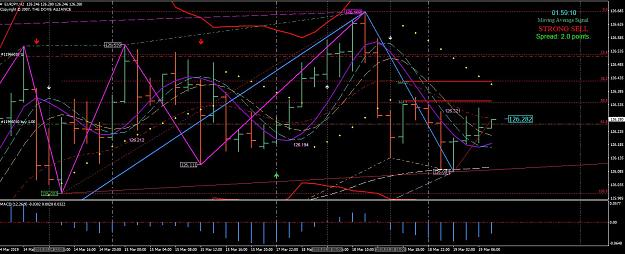
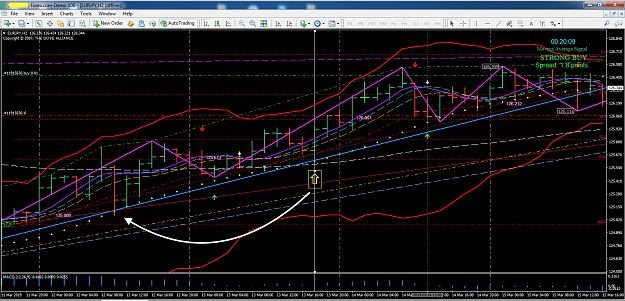
Moving forward is the finishing of the trend. Pictures speak a thousand words. Which means you have no excuses.
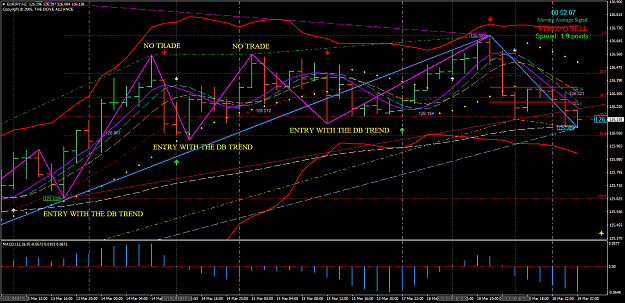
This screen shot is showing the beginning of the trend with the DB/SAR and Divergences.
Attached Image (click to enlarge)
Moving forward is the finishing of the trend. Pictures speak a thousand words. Which means you have no excuses.
Attached Image (click to enlarge)
The Dove - Forex Trainer
7