Allan I struggle to get the main direction at times like yesterday there were bearish divergence on the 1hr and the trend went bullish.
Ignored
You should be saying to yourself "price is ignoring the divergence so it is trying to get somewhere'
Consider on the 1 hour which side of the EMA is price trading...Topside
So have the bulls found support... Yes
So the market is bullish. BUT it will not remain bullish forever once it takes out the targets it becomes too risky to keep going long.
Any bear signals should be considered as scalps or hedges. So if you spotted a bearish div consider it as such. If it doesn't make it back to the EMA then price is going to climb higher.
Always consider the trending side in conjunction with the EMA and look to see where the EMA is trying to get to and has it failed in the opposite direction.
{quote} Alan's Best Calculated Destination indeed. Daily done after failing at -50%. {image}
Ignored
Hey David or Alan, can you clarify for me the basis of constructing these target points ? They are not drawn to specific highs or lows and the logic of the construct presently escapes me. My inability no doubt but . . . . . . HELP !!!!!
Thanks.
{quote} Hey David or Alan, can you clarify for me the basis of constructing these target points ? They are not drawn to specific highs or lows and the logic of the construct presently escapes me. My inability no doubt but . . . . . . HELP !!!!! Thanks.
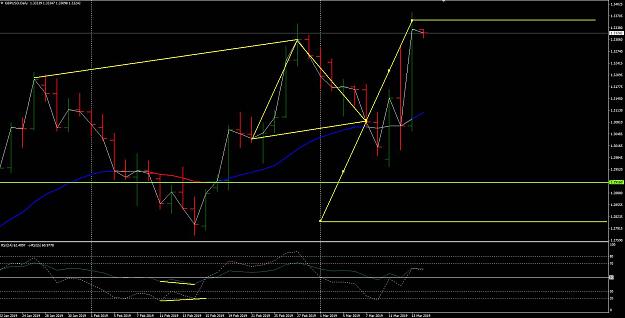
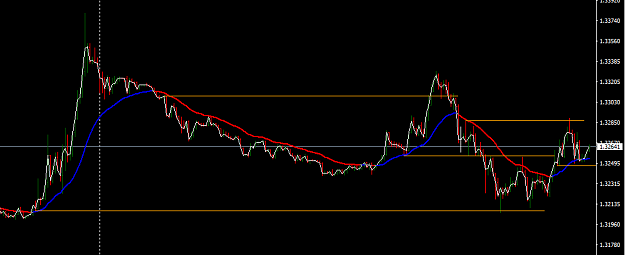
The XA line is a regular divergence but it has failed to cross the EMA so it should make a HH.
Where is that HH?
On price, C is attacking the pivot B. Now look at the RSI and C has already passed B. So this forms the ABC triangle and the target D is the same distance as AB taken from C.
Price also moved to C2 so this may be a correction we have to consider, C@ was also a retrace to the 61.8.
OK - thanks for your response. I will have to grapple with this one. David has taken a 23 or so daily div. and worked from that. I concede a chart is a chart, is a chart but I struggle a little with a 23 day divergence. I will retire to my cave and try draw this out to see it clearly.
Thanks Alan.
OK - thanks for your response. I will have to grapple with this one. David has taken a 23 or so daily div. and worked from that. I concede a chart is a chart, is a chart but I struggle a little with a 23 day divergence. I will retire to my cave and try draw this out to see it clearly. Thanks Alan.
Ignored
Don't forget also that the half way point (50%) is a danger point to consider.
Here you see the half way point was a Div on the 1 minute chart sending price back below the 1 min EMA
I wanted to comment that failed 50%, but was short that time and I m rather superstitious when trading (was short at 1.3310 (target was 1.32-1.3180), but unfortunately stopped out at 1.3235.
Used both C-C2 (but since market did C2 preferred that one.
(your morning analysis helped me a lot)
|
Joined Dec 2013
|
Status: Trader
|166 Posts|
Online Now
I see that many of the people new to this method are struggling with direction.
What I focused on when I started trading this method was:
1. EMA success or failures. Which way did the EMA break last? In other words, which EMA pivot was broken and which was challenged, but was not broken?
Do this exercise for all the time frames, and also note (for each time frame) which side of the EMA price is trading.
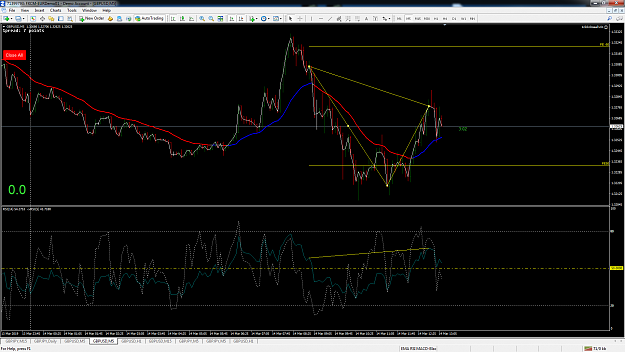
2. Support. After the price crosses the EMA it needs to find support before we trust that it will continue in that direction. Just look at the M5 chart below and see how price found support before the major drives. Also see how price reacts to old support.
With these basic and easy concepts you will get a good grasp of where price is likely to go.
So before you start focusing on divergence and targets you need to master the basics... you need to get in a trade in the right direction before you start thinking about hedges and targets
I see that many of the people new to this method are struggling with direction. What I focused on when I started trading this method was: 1. EMA success or failures. Which way did the EMA break last? In other words, which EMA pivot was broken and which was challenged, but was not broken? Do this exercise for all the time frames, and also note (for each time frame) which side of the EMA price is trading. 2. Support. After the price crosses the EMA it needs to find support before we trust that it will continue in that direction. Just look at the M5...
Ignored
This is exactly correct and what I set out in the first place when trading between the averages.
When the average fails one side it then tends to test the opposite direction.
Concentrate on what the averages are doing before considering the other stuff which are the mechanics of getting from one pce to the other.
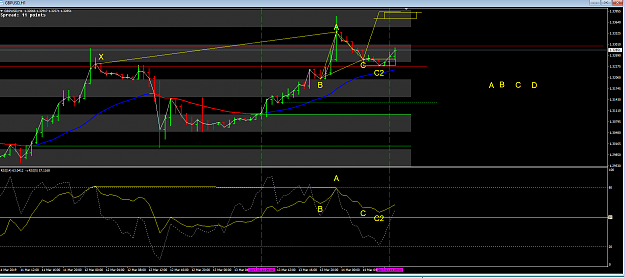
Consider this... The XA line is a regular divergence but it has failed to cross the EMA so it should make a HH. Where is that HH? On price, C is attacking the pivot B. Now look at the RSI and C has already passed B. So this forms the ABC triangle and the target D is the same distance as AB taken from C. Price also moved to C2 so this may be a correction we have to consider, C@ was also a retrace to the 61.8. {image}
Ignored
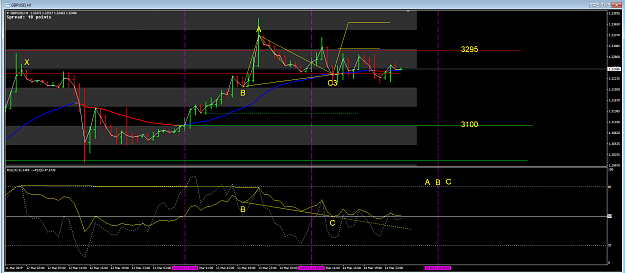
Alan in this example you took point C attacking B (and drawn D accordingly). When price passed C to C2, should we redraw our ABCD?
Why did you take C and not C2? C2 isn't closer to point B as for attacking point?
{quote} Alan in this example you took point C attacking B (and drawn D accordingly). When price passed C to C2, should we redraw our ABCD? Why did you take C and not C2? C2 isn't closer to point B as for attacking point?
Ignored
Hi forex dimi
Of course C2 is closer to B by a factor of 15 pips or so and the C point has still continued to adjust C3 but it still remains above B.
Now if we extend the BC line (dotted) we can see the bears have created some wriggle room whereby they can effectively get past the B point on the price by remaining above the dotted line on the RSI until they are good to go. This is a battle zone for positioning.
At the same time we see the average has made the HH and must wonder if the bulls are going to be strong enough to take of the next level (3295) or will we see the bulls collapse and the bears attempt the test of 3100. No point making speculations we must wait and look for evidence of direction.
I see that many of the people new to this method are struggling with direction. What I focused on when I started trading this method was: 1. EMA success or failures. Which way did the EMA break last? In other words, which EMA pivot was broken and which was challenged, but was not broken? Do this exercise for all the time frames, and also note (for each time frame) which side of the EMA price is trading. 2. Support. After the price crosses the EMA it needs to find support before we trust that it will continue in that direction. Just look at the M5...
{quote} Fxmars what direction did you take on Friday
Ignored
The short version is that I was long.
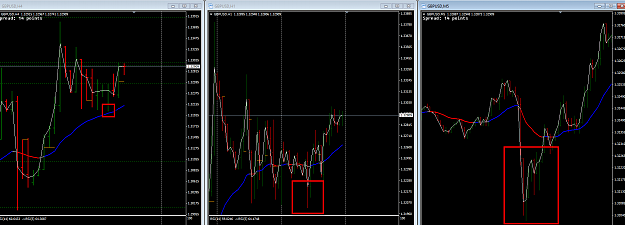
At Frankfurt Open there was no support on H1, price kept closing on both sides of the EMA. However, from earlier in the week, and also inference from H4, we were clearly in an bullish market. So my plan was, on H1, to wait for either a pullback or H1 bullish support, whichever would happen first.
As price was trading above it, the H4 EMA seemed like a logical place to look for longs. And as per the attached chart, that is also what happened. My entries were on M5 and M1.
But it is important to note that, even though this was my plan, I would have started taking shorts as soon as my charts indicated bearish sentiment. In particular, if we had gotten bearish support on H1. We should trade what we see on the chart and not get attached to a preconceived notion about were we think/feel/hope price will go.
So yes, former price and EMA activity does have merit. But it will never trump what is happening right now on the chart.
And to confuse people further, I am myself more of a scalper than a swing trader, so personally, I do trade both directions, mostly on M1 charts. Normally, in a bullish market, there will be plenty of room to take shorts on the pullbacks. So bullish or bearish overall direction is relative to the time frames you are looking at. The most important entry criteria for me is whether or not I can get on a tight SL, and whether or not there is enough room for me to easily get the SL to BE.