But who knows what the market is gonna do tonight when the Brexit deal most likely will be voted down again...
And if we get a no vote tonight (which is likely according to the polls) Parliament will vote on whether the UK shall leave the EU without a deal or not, that vote is on Wednesday.
And if that is another no (to leave without a deal), then another vote on whether Brexit will be postponed (indefinitely) or not will be held on Thursday.
{quote} Hi, what inference did you take to get in that trade?
Ignored
If you look at the chart i posted there is a bullish divergence I took for inference, and the trade was taken based on the bulls finding support on the 1min.
The higher time frames were above the MA so i was long biased at the time of the trade.
{quote} This is exactly what I have uttered in the past. You may also note that if we have a target price will run to it prior to the major news event, seems like the target has to be taken out in readiness for such news. I say be aware of the major news events in connection with the price targets. So if by Tuesday we have a target then look to see it hit before the Brexit news. This happens so often and is one of the reasons I ignore the news entirely simply because the target either gets hit or it doesn't and I get stopped out.
Ignored
Hi Alan, I´d love to ignore the news, the problem is my "friendly broker" will spike the spread even if Theresa May sneezes...on news, the spread could widen up to 50 pips.
I am looking for some general advice on interpreting Bullish/Bearish ABCD's. I am getting there with regard to drawing these on the charts and on most occasions the targets etc tend to agree with those published by those contributing to the thread. Where I am struggling is in identifying the ABCD as Bullish or Bearish. As such I would be grateful if anyone could give some perspective on what additional factors contribute to the identity of the ABCD. Do you refer solely to the bullish / bearish criteria on the higher time frames or do you take into consideration any other additional factors ? if so it would be great to hear your views as it would really help me get a handle on these. I have gone through the thread a number of times and have picked up some ideas in relation to ABCD's but am still trying to get my head around them.
Again to give you an idea of what i'm talking about...
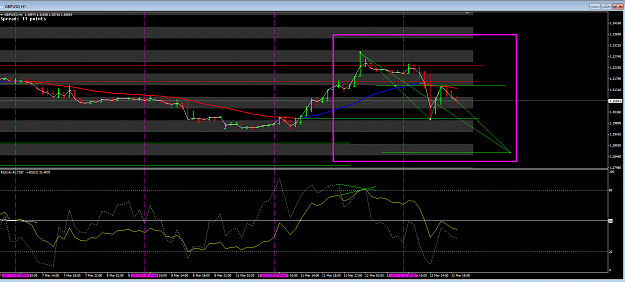
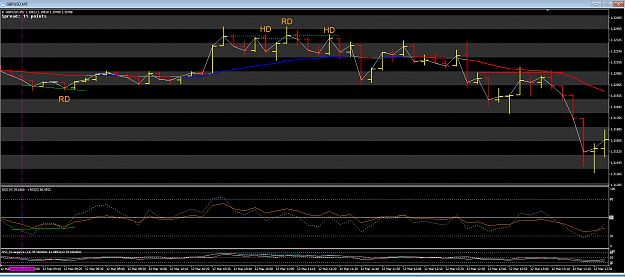
Could people comment on whether they see the following as Bullish/Bearish, I appreciate that H1 , H4 && Daily are above EMA so should be looking for bullish trades on M5 however the attached ABCD appears to be moving price downward perhaps to 50% but how would I go about interpreting the correct direction
{image} Hi Folks, I am looking for some general advice on interpreting Bullish/Bearish ABCD's. I am getting there with regard to drawing these on the charts and on most occasions the targets etc tend to agree with those published by those contributing to the thread. Where I am struggling is in identifying the ABCD as Bullish or Bearish. As such I would be grateful if anyone could give some perspective on what additional factors contribute to the identity of the ABCD. Do you refer solely to the bullish / bearish criteria on the higher time frames...
Ignored
Hi Des.
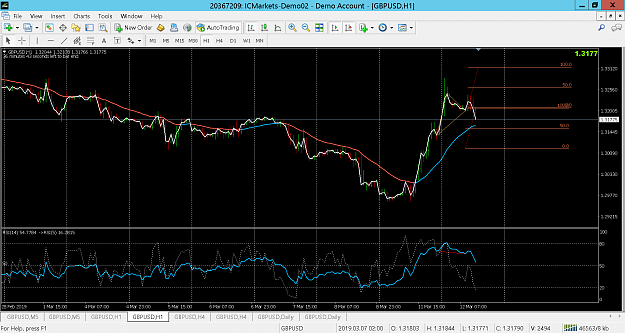
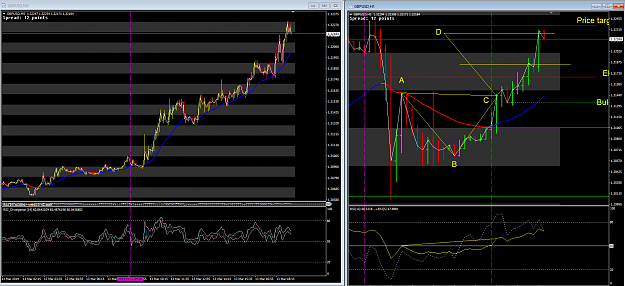
I think you are missing the point. The ABCD does not imply an entry one way or the other it simply defines a possible target.
If we see at the lower time frames we are moving in the direction of such a target then that is the corresponding direction we trade.
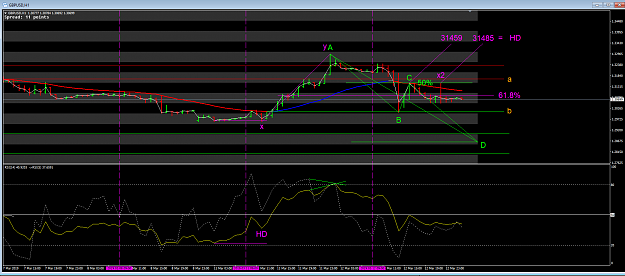
For example look at the 1 hour chart below and we see the formation of not an ABCD but a AB = CD. At the lower time frame i,e, (5 min) we would be looking to short until we reach our money target is reached.
{quote} Hi Alan, I´d love to ignore the news, the problem is my "friendly broker" will spike the spread even if Theresa May sneezes...on news, the spread could widen up to 50 pips.
Ignored
You should have completed trading long before the news. There were ample signals.
So as I awake to check the overnight results I see there wasn't any.
Mere rumour and speculation moved the market over the last two days, the actual result of the news had little to no effect at all. This is why I keep saying watch the signals and not the news in order to go with the flow of market speculation.
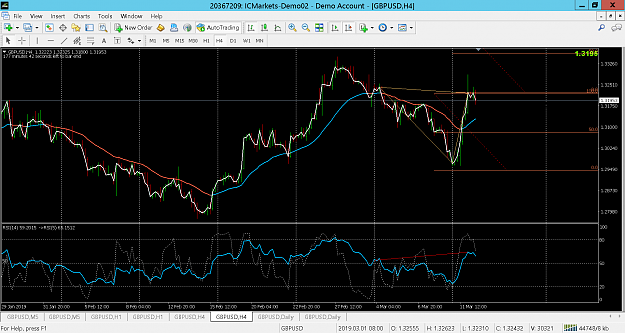
Clearly you can see the price dropped to the previous swing low average (b) but the actual average still remains between a and b. We can see the day before the attempt was made for the average to break (a) but failed. Price itself has settled down to a retrace of 61.8% so we are now not sure of a continuation down to the D or indeed an attempt to make a HH than Y.
x was one of the clearest HD signals we have had for some time and to me these divs give the most mileage when it comes to price movement, it is almost like a secret signal. We see this again at x2 where a HD snaps back at least 60 pips.
So taking all these inferences and converting them to ZOO points to be traded at the lower levels there is ample opportunities to trade this factual information rather than any form of speculation whether that be news or what one may 'think' the market should do.
Now I don't have any idea whatsoever that this AB = CD has formed, I only have clues given me by the A+B+C whereas D remains a mystery until the pattern completes, it is not written in stone. These D points are the potential targets we can aim for at the lower chart time levels. As are the average swing points potential target levels. As are the Fibo levels. As are the divergences, As are the ABCD's and as are the 26 EMA. All potential targets we can aim for and we are going to see heaps of signals taking us in the target direction on the lower time frame.
We cannot set these targets in stone so we have to be flexible enough to hedge contrary situations to protect the trade as a form of insurance.
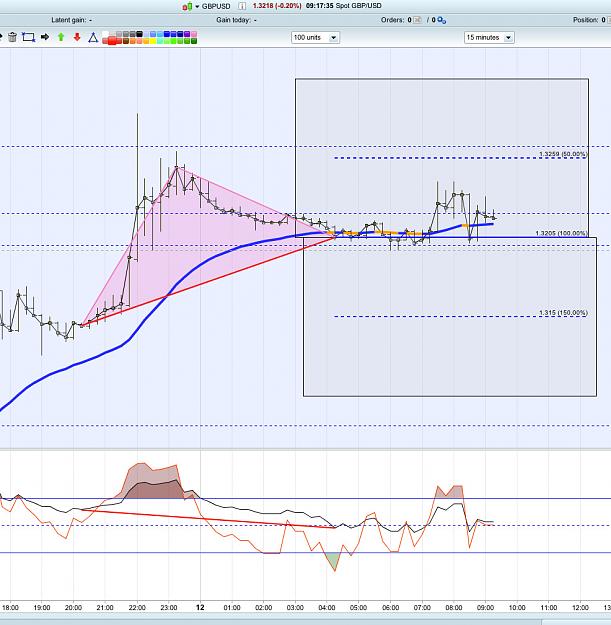
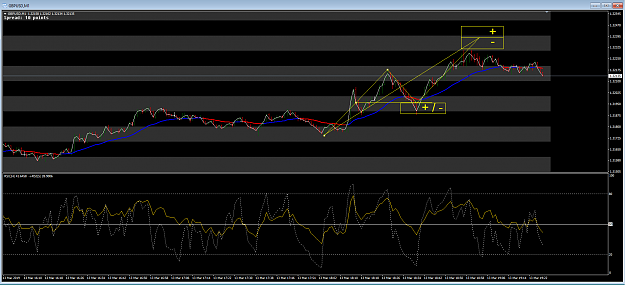
Let's look at the exercise of drilling down to the lower charts from the inference of the 1 hour.
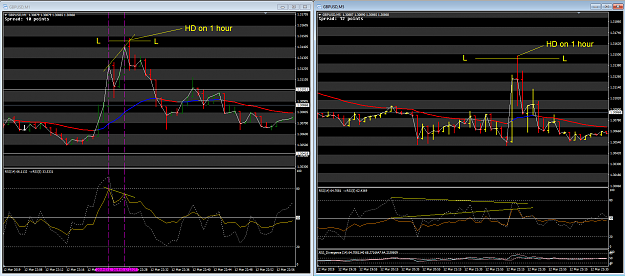
More specifically let's look at the x2 hidden div.
Looking both at the 1 minute chart and the 5 minute chart we can drill on down to really pinpoint the entry.
The yellow line L L represents the 1 hour level where price runs into a hidden div situation. That is to say the price is passing the pivot but the RSI is not.
In this case it is the 1 minute chart that gives the best indication. Remember we are not interested until price is above the LL.
So what do we see? The 1 minute chart is in divergence and the fast RSI on the 5 min would have been way up in the top levels of the RSI. These are good indications the 1 hour is coming to a halt and give us very tight locations to put our stops. Even on the 1 minute chart the return to cross the EMA is over 60 pips and the same on the 5 min chart because a little later we saw an RSI divergence there.
That tiny bit of HD on the 1 hour was the inference and this was supported by the trades we could have taken on the lower time frames with very tight stops. This is what inference is all about.
Sometimes, in fact many times we have no other inference from the 1 hour other than the direction it is travelling in either above the EMA or below. This is when we have to go just with the signals off the lower time frames in the hope of reaching the targets set by the higher one.
Hi everybody,
Do you guys have any tool to draw ABCD on MT4 platform?
For now, I have to draw a line from A to B then drag that line to C to define D points. That's too slow, don't you think?
Thanks in advance
Now I don't have any idea whatsoever that this AB = CD has formed, I only have clues given me by the A+B+C whereas D remains a mystery until the pattern completes, it is not written in stone. These D points are the potential targets we can aim for at the lower chart time levels. As are the average swing points potential target levels. As are the Fibo levels. As are the divergences, As are the ABCD's and as are the 26 EMA. All potential targets we can aim for and we are going to see heaps of signals taking us in the target direction on the lower...
{quote} Hi Des. I think you are missing the point. The ABCD does not imply an entry one way or the other it simply defines a possible target. If we see at the lower time frames we are moving in the direction of such a target then that is the corresponding direction we trade. For example look at the 1 hour chart below and we see the formation of not an ABCD but a AB = CD. At the lower time frame i,e, (5 min) we would be looking to short until we reach our money target is reached. {image}
Ignored
Thanks Alan for taking the time to explain, appreciate your help
Cheers...Des
Ok back from shopping.. Let's look at the exercise of drilling down to the lower charts from the inference of the 1 hour. More specifically let's look at the x2 hidden div. Looking both at the 1 minute chart and the 5 minute chart we can drill on down to really pinpoint the entry. The yellow line L L represents the 1 hour level where price runs into a hidden div situation. That is to say the price is passing the pivot but the RSI is not. In this case it is the 1 minute chart that gives the best indication. Remember we are not interested until price...
Ignored
Allan it would be nice if yo can give us your normal 1hr 5min charts it dos help the learning curve.
 Trading the Cable swings via averages