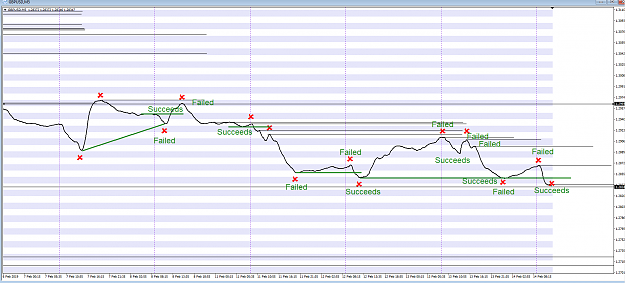
So looking at the 5 min EMA chart we can see clearly what the trade was all about.
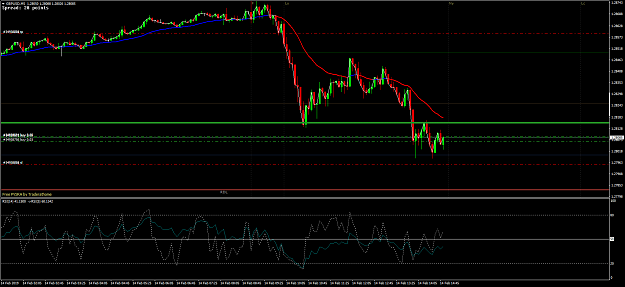
X is where we are looking for a divergence. Then we got the bear support so now we can see where the EMA is going to try for and price will stay ahead of the EMA to pull it down,
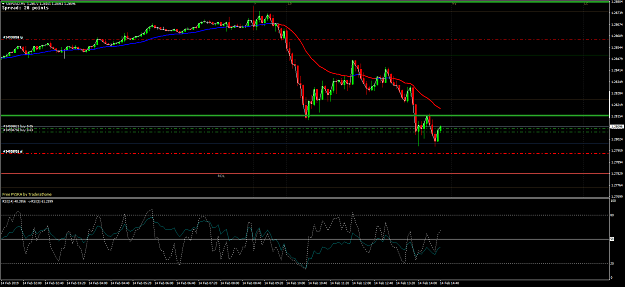
{quote} Mike, in the attached a pivot was formed where the yellow trendline begins. Price then dips and comes back to that level so on that bullish candle labeled "check here for HD" if at any time (no need to wait for close) price was higher than the pivot of interest while RSI was lower that is an HD. In this case it ended up being a regular divergence as price rose slightly higher. I believe this would've been an HD but I missed it and entered after regular divergence. {image}
Ignored
so it basically checking for a live divergence rather than waiting for the bar to close
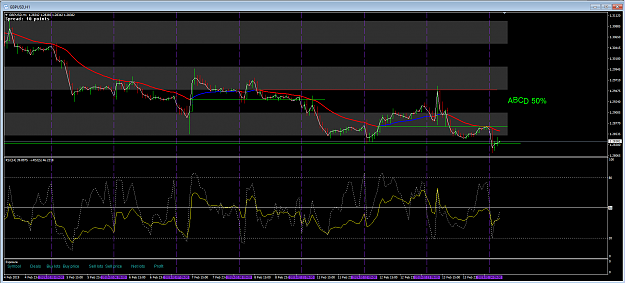
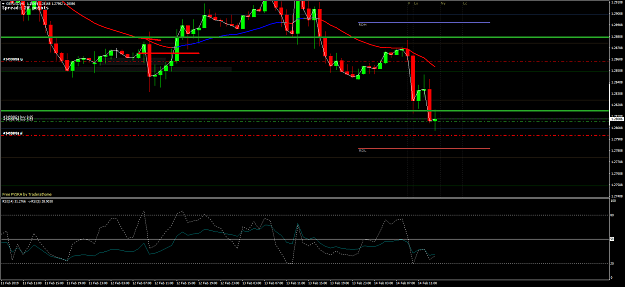
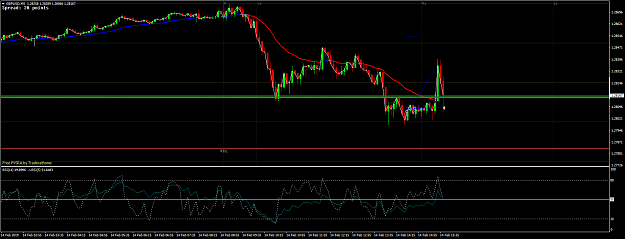
Morning all, I have a question. When drawing an ABCD pattern from a continuation divergence on the 1hr is is correct to derive the pattern from any type of divergence? i.e would the following image qualify? or should we only use a chart price and rsi based divergence to derive the pattern. Thanks. {image}
Ignored
For continuations you only look at regular divergence. For bullish abcd compare pivots that have formed higher lows, and bearish compare lower high pivots. Also, only compare pivots "under attack". Alan has shown many examples in this thread so there is plenty for you to review.
{quote} For continuations you only look at regular divergence. For bullish abcd compare pivots that have formed higher lows, and bearish compare lower high pivots. Also, only compare pivots "under attack". Alan has shown many examples in this thread so there is plenty for you to review.
So looking at the 5 min EMA chart we can see clearly what the trade was all about. X is where we are looking for a divergence. Then we got the bear support so now we can see where the EMA is going to try for and price will stay ahead of the EMA to pull it down, {image}
Ignored
Hi Alan,
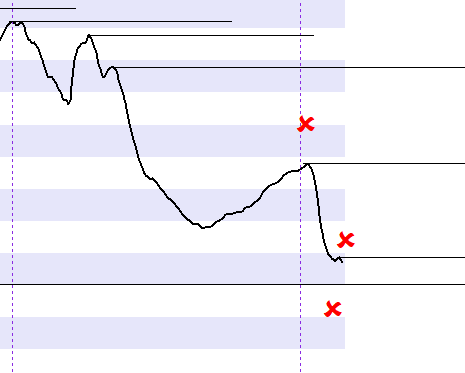
Would it be too much to ask that you elaborate a bit more on the different places we should put the red crosses? There were a couple of posts that touch on that but they're not very specific (at least for me). Only if you can - otherwise, the experience will kick in at some point
{quote} Hi Alan, Would it be too much to ask that you elaborate a bit more on the different places we should put the red crosses? There were a couple of posts that touch on that but they're not very specific (at least for me). Only if you can - otherwise, the experience will kick in at some point Thanks!
Ignored
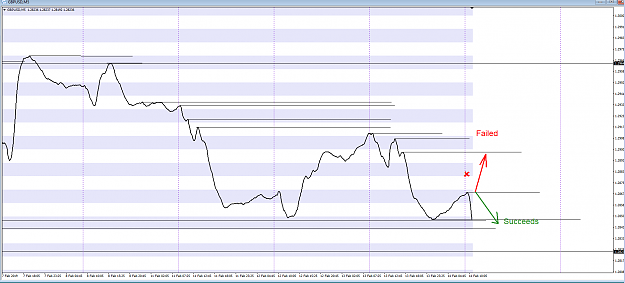
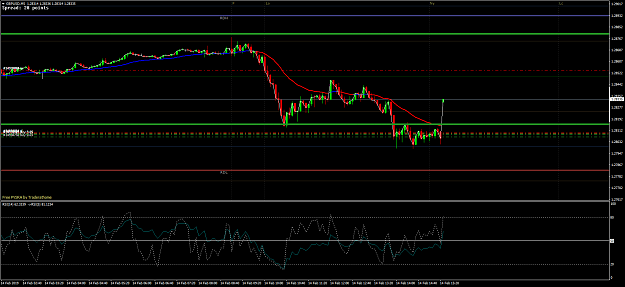
Sure that red cross you see on my 5 min chart always leads the EMA and is simply an indication where to look for the divergences.
So in this particular case we had a bearish divergence which should send the price back across the EMA.
If that turns out to be true then the AVERAGE has FAILED in its attempt to make a HH.
So then the EMA will test the LL which it did.
There are no different places to put this red cross it always leads the EMA like this...
{quote} Sure that red cross you see on my 5 min chart always leads the EMA and is simply an indication where to look for the divergences. So in this particular case we had a bearish divergence which should send the price back across the EMA. If that turns out to be true then the AVERAGE has FAILED in its attempt to make a HH. So then the EMA will test the LL which it did. There are no different places to put this red cross it always leads the EMA like this... {image}
Once the EMA has broken the level that is the trade over with.
Right at the very beginning I told all that if you don't believe the average is always trying to make HH's or LL's you are wasting your time on this thread.
If it fails one side it tests the opposite side.
This is a fact you can easily check just by looking at the chart... Fails one side results in testing the opposite.
We can get a situation where both sides fail, neither side can win so the market goes flat.
We look for the failure points and look to the next opposite level