I thought it was the next valid signal to trade as I missed the initial HD because I wasn't at my PC.
Ignored
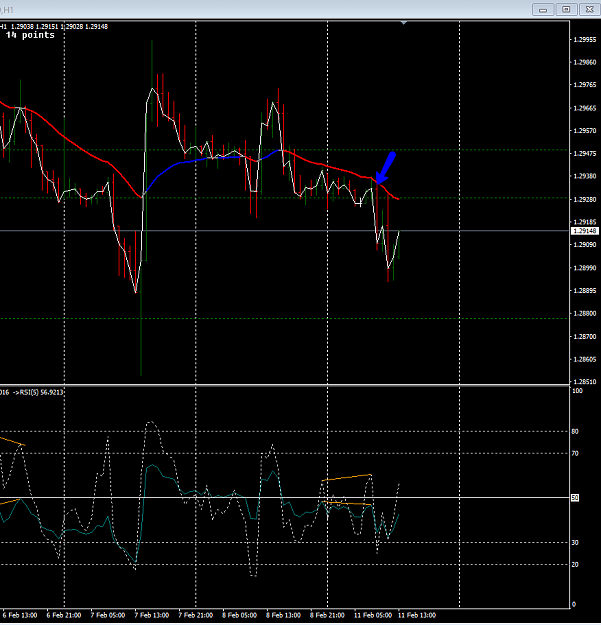
Hi, a friendly suggestion; never take a trade based on M5 time frame alone.
The backbone of this method is to take inference from a higher time frame.
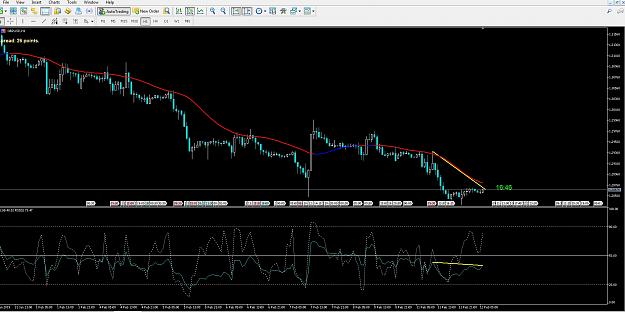
As per the chart below, at the time of news, we were trading below the H1 ema.
Additionally we were trading below previous average low of 2928. And clearly the market was trying to reach the H4 level 2880 (as Alan pointed out in a post earlier today) and H1 level 2877.
And the third clue, the massive bearish bar (blue arrow).
These were 3 solid reasons to be short.
The only time you should take counter trend trades based on divergence on M5 is when price is at a former major level, preferably from a higher time frame.
{quote} Hi, a friendly suggestion; never take a trade based on M5 time frame alone. The backbone of this method is to take inference from a higher time frame. As per the chart below, at the time of news, we were trading below the H1 ema. Additionally we were trading below previous average low of 2928. And clearly the market was trying to reach the H4 level 2880 (as Alan pointed out in a post earlier today) and H1 level 2877. And the third clue, the massive bearish bar (blue arrow). These were 3 solid reasons to be short. The only time you should...
Ignored
Thanks for the reply. This is great info for me. Many thanks.
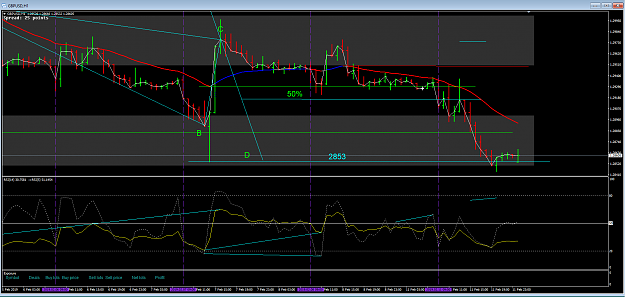
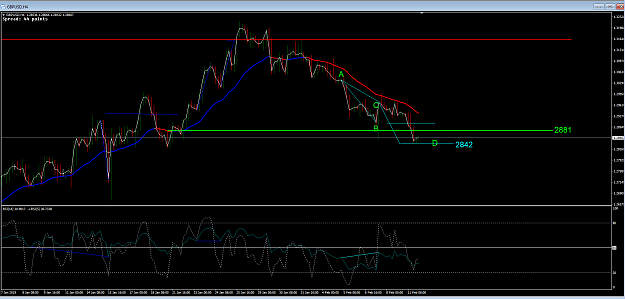
Well done again Alan. As for the 4H, bullish regular divergence formed overnight (at your previous D point). Target for this one is around 3215. {image}
Ignored
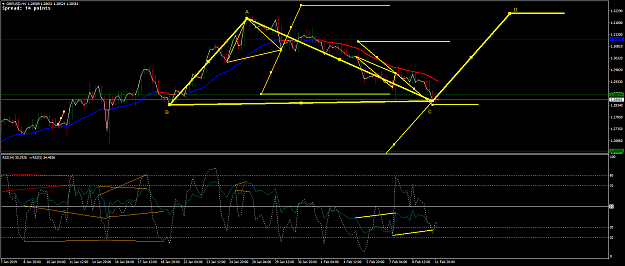
David that large ABCD is drawn wrongly, there is no BC line on the RSI.
What you do have is a regular bullish divergence (the lower of the lines drawn on the RSI) which I would expect to fail because the EMA is trying to make the LL of that previous swing.
{quote} David that large ABCD is drawn wrongly, there is no BC line on the RSI. What you do have is a regular bullish divergence (the lower of the lines drawn on the RSI) which I would expect to fail because the EMA is trying to make the LL of that previous swing.
Ignored
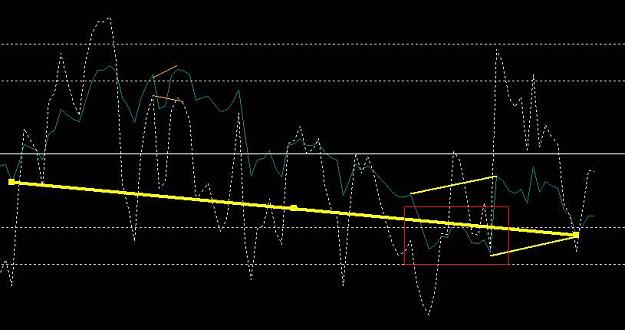
Alan, when you say no BC line, that is because it cut through the RSI lows in the rectangle?