• Home
  • Forums
  • Trades
  • News
  • Calendar
  • Market
  • Brokers
  • Login
  • Join
  • User/Email: Password:
  • 10:30pm
Menu
  • Forums
  • Trades
  • News
  • Calendar
  • Market
  • Brokers
  • Login
  • Join
  • 10:30pm
Sister Sites
  • Metals Mine
  • Energy EXCH
  • Crypto Craft

Options

Bookmark Thread

First Page First Unread Last Page Last Post

Print Thread

Similar Threads

Paradox System: post your entry here 12 replies

Paradox system avg monthly ROR for last 12 months 33 replies

Learning the Paradox System=Set up / Trade Plan / Results Only 1 reply

MTS Vs Random Entry - A Paradox 6 replies

lets talk about the system called PARADOX 2 replies

  • Trading Systems
  • /
  • Reply to Thread
  • Subscribe
  • 4,250
Attachments: The Paradox System
Exit Attachments
Tags: The Paradox System
Cancel

The Paradox System

  • Last Post
  •  
  • 1 760761Page 762763764 863
  • 1 Page 762 863
  •  
  • Post #15,221
  • Quote
  • Jan 31, 2019 1:31pm Jan 31, 2019 1:31pm
  •  Iris2018
  • | Joined Nov 2018 | Status: Member | 385 Posts
Good evening! Sorry, I was walking and could not answer right away!

I am very grateful and pleased with your answer.
The lesson is very important.
I understood my two mistakes:
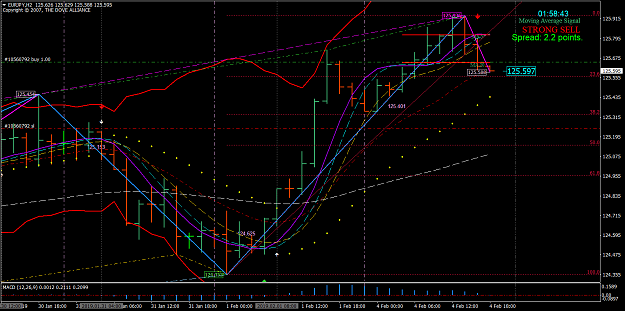
1. I traded a range. Took the basis of a blow in the DB merger supports. But the BB bands were no longer flat, but began to open. We moved to consolidation from rendzh.
2. In consolidation, I needed to see either trend synchronization on H1, H2, or Fibo H2 synchronization, H4. And trade to the nearest resistance
This is what I understood in the moment. I will reread your lesson to full understanding.

Thanks again, respectfully Irina
Either I will find a way, or I will make one...
 
 
  • Post #15,222
  • Quote
  • Jan 31, 2019 11:48pm Jan 31, 2019 11:48pm
  •  dove_alliance
  • Joined Jun 2007 | Status: Trading Live For The Last 14 Years. | 5,761 Posts
I got a question from a trader as a PM and I will post it and answer the question as I feel it was good question for everyone:

The Question:

Hi Sir, You replied on iris's post saying this statement:

"You must always visual each chart and see what is happening before pulling the trigger. The H4 with a Red Fibo and the 23.6 being support - you needed a bar opening below the 23.6 for entry going short. There was no long entry just because of the H4 Red Fibo. And that is not going to change until the low at 123.779 is no longer a visual."

Sir, I'm confused of 23.6 Fibo is being said as support. Did you mean 23.6 as a resistance? I will need your reply Sir, Thank you and God blesses.

The Answer:

In my tutorials I had spoken about the support and resistance with the Fibo. The 23.6 and the 61.8 are very heavy support/resistance depending on direction. On a Red Fibo with 0.0 on top as support (correction: as resistance) you have the 23.6 your first support. Once the 23.6 is broken with and open bar then the 61.8 will be the target for your second heavy support. You also need an open bar below the 61.8 before you take entry.

Reverse this and you have the 0.0 on the bottom as a Green uptrend Fibo with the 23.6 and the 61.8 as resistance. And again you have both levels heavy Resistances.

In the moment you had the H4 Fibo hit the 61.8 Support and the H2 at the 0.0 Green Fibo.

The H4 is your dominate Fibo for trading. And because of the 61.8 Fibo on the H4 is Red, being support, means you must wait on the H2 for either a slider or turn. If it is a slider then the H4 will show the 61.8 being broken with an open bar for a continuance of the downtrend.

I had to Make a correction between support and resistance. The reason is because the Red 0.0 is resistance and the Green 0.0 is support. The 61.8 and the 23.6 are BOTH SUPPORT AND RESISTANCE depending on direction of the trend.
The Dove - Forex Trainer
 
9
  • Post #15,223
  • Quote
  • Jan 31, 2019 11:59pm Jan 31, 2019 11:59pm
  •  killerxover
  • | Joined Feb 2010 | Status: Member | 81 Posts
Quoting dove_alliance
Disliked
I got a question from a trader as a PM and I will post it and answer the question as I feel it was good question for everyone: The Question: Hi Sir, You replied on iris's post saying this statement: "You must always visual each chart and see what is happening before pulling the trigger. The H4 with a Red Fibo and the 23.6 being support - you needed a bar opening below the 23.6 for entry going short. There was no long entry just because of the H4 Red Fibo. And that is not going to change until the low at 123.779 is no longer a visual." Sir, I'm confused...
Ignored
Thank you Sir for your clarification.
 
 
  • Post #15,224
  • Quote
  • Feb 1, 2019 12:00am Feb 1, 2019 12:00am
  •  dove_alliance
  • Joined Jun 2007 | Status: Trading Live For The Last 14 Years. | 5,761 Posts
I made a correction on my last posting so re-read to understand the correction.
The Dove - Forex Trainer
 
1
  • Post #15,225
  • Quote
  • Feb 1, 2019 2:50am Feb 1, 2019 2:50am
  •  Iris2018
  • | Joined Nov 2018 | Status: Member | 385 Posts
Result: SL -40 pips
Trade valuation: nevrnoy direction. Teacher described my mistakes in this transaction. I am very grateful to Him.
I understood his lessons and will apply this knowledge
Either I will find a way, or I will make one...
 
 
  • Post #15,226
  • Quote
  • Feb 1, 2019 3:37am Feb 1, 2019 3:37am
  •  Iris2018
  • | Joined Nov 2018 | Status: Member | 385 Posts
Trading plan 01/02/2019
Economic news : Average Hourly Earnings m/m, Non-Farm Employment Change, Unemployment Rate, ISM Manufacturing PMI
Daily
ROMAR - resistance
EMA - support
Parabolic - support
Last DB Attachment – up at 125,454(with 2 Divergence)

Fibonacci – green.
The candle opened under the parabolic but it did not turn over. BB flat.
H4 ROMAR – support/ resistance EMA - resistance Parabolic – resistance
Last DB Attachment –down at 124.353 (with 1 Divergence)
Fibonacci – red. Riders pointing up
H2
ROMAR – resistance

EMA – resistance
Parabolic- resistance

Checklist: Last DB Attachment –down at 125.353 (with 2 Divergence)
Last SAR Attachment – down at 124.354
Purple crossed white
Fibonacci –green. H1 ROMAR - resistance
EMA - - resistance
Parabolic- resistance

Fibo –green. Purple crossed white and smooth
At the opening of London there is no entrance. 1. Sales. With the SAR application on H2, there is no 40 points to Fibo 0. 2. Buy. H1 shows the first stage of a reversal, but there is no intersection of the EMA and purple, the parabolic is not fixed. H2 not synchronized with H1. There is only the intersection of white and the opening of the candle above the EMA. I am waiting for confirmation of a reversal (the intersection of EMA and violet) and preferably the intersection of violet and romance H2 (so as not to trade against the trend). H4 the candle opened above fibo 61.8, but the horsemen are pointing down, the candle has opened under the romar, which means it is still possible to go south.
Conclusion: I am waiting for the synchronization of H1, H2 and carefully watch the next spark H4. Because of the red news, I will not be able to enter the next candle H4, even if there is an entrance - there is no time to close.
Either I will find a way, or I will make one...
 
 
  • Post #15,227
  • Quote
  • Feb 1, 2019 10:36am Feb 1, 2019 10:36am
  •  dove_alliance
  • Joined Jun 2007 | Status: Trading Live For The Last 14 Years. | 5,761 Posts
OK traders - I had given everyone an entry off the H4 61.8 and the H2 0.0 hits. That was confluence with the Fibo. But no takers for the entry. The only way this will work properly is the spread of 40 with 39 showing on the bars. If you do not have the right spread then the fibo's are useless.

As everyone can see how the 61.8 and the 23.6 works as support and resistance. Coming off the H4 61.8 and the H2 0.0 was entry heading back to the top. If you also had noticed I had seen this before the fact, looking into the future, in exactly what the market was going to do. There was no thinking about it or analyzing anything; only following the rules of the Paradox and I do not lose. This is the reason why I brought it forth; as I had seen it before it even happened.

The Paradox is limitless in opportunities of taking 40 pips each and every trading day. This is why the Paradox is a 6 month process of a college education in learning. Every indicator has a purpose and reason for the Paradox to be limitless for entries and exits; and there is no other system in the world can do as the Paradox does.

I suggest everyone spend the weekend of learning everything you can about the Paradox Fibo's.
The Dove - Forex Trainer
 
9
  • Post #15,228
  • Quote
  • Feb 1, 2019 10:58am Feb 1, 2019 10:58am
  •  dove_alliance
  • Joined Jun 2007 | Status: Trading Live For The Last 14 Years. | 5,761 Posts
Let me give everyone another reminder as I have given many, many times. The Paradox is about support, resistance, and trend. If you are trading outside of that realm then you will lose your trade.
The Dove - Forex Trainer
 
2
  • Post #15,229
  • Quote
  • Feb 1, 2019 11:30am Feb 1, 2019 11:30am
  •  dove_alliance
  • Joined Jun 2007 | Status: Trading Live For The Last 14 Years. | 5,761 Posts
The Market is now balanced as the Daily 125.716 line had been hit.
The Dove - Forex Trainer
 
3
  • Post #15,230
  • Quote
  • Feb 1, 2019 11:50am Feb 1, 2019 11:50am
  •  Iris2018
  • | Joined Nov 2018 | Status: Member | 385 Posts
Good evening! Thanks for your lessons! This is really a new and useful material.
Unfortunately, I could not take your entrance, although I saw it because it was my night. I slept. I really wanted to go in with the opening of London in the purchase, but there was no 40 points to the H2 romare and confirmation of the reversal (synchronization H2, H1). As history has shown, I could not get a TP before the red news at this entrance.
And the last question for securing the material.
This input from 0 fibo works only in consolidation, but not in trend. Right?
Either I will find a way, or I will make one...
 
 
  • Post #15,231
  • Quote
  • Edited 12:32pm Feb 1, 2019 12:20pm | Edited 12:32pm
  •  dove_alliance
  • Joined Jun 2007 | Status: Trading Live For The Last 14 Years. | 5,761 Posts
Quoting Iris2018
Disliked
Good evening! Thanks for your lessons! This is really a new and useful material. Unfortunately, I could not take your entrance, although I saw it because it was my night. I slept. I really wanted to go in with the opening of London in the purchase, but there was no 40 points to the H2 romare and confirmation of the reversal (synchronization H2, H1). As history has shown, I could not get a TP before the red news at this entrance. And the last question for securing the material. This input from 0 fibo works only in consolidation, but not in trend. Right?
Ignored
No - the 0.0 is the beginning of a new reverse cycle trend with a new bar. When you have all 4 charts sync with a full blown tend then the 0.0 will continue to move on each hit until the ending of the trend. Once it ends then a new reverse trend takes place. The only consolidation the Fibo recognize is if one of the Fibo's of the 4 charts is not sync with the others - then all charts are in consolidation.
The Dove - Forex Trainer
 
6
  • Post #15,232
  • Quote
  • Feb 4, 2019 2:32am Feb 4, 2019 2:32am
  •  Iris2018
  • | Joined Nov 2018 | Status: Member | 385 Posts
Trading plan 04/02/2019
Economic news : no
Daily
ROMAR - resistance
EMA - support
Parabolic - support
Last DB Attachment –top at 125,725 (2Diver)
Fibonacci – green. Riders pointing up. BB is opened - exit from ranking. Market is balanced.
H4
ROMAR - support
EMA - support
Parabolic – support
Last DB Attachment –top at 125.725 (1 Diver)
Fibonacci – red. Fibo coup through two bars. Riders pointing up
H2
ROMAR – support
EMA – support
Parabolic- support
Checklist:
Last DB Attachment –top at 125.725 (1 Diver)
Fibonacci – red. Purple crossed white
H1
ROMAR - support
EMA - - support
Parabolic- support
Fibo –red. Riders pointing up Consolidation. Rules for determining consolidation: 1: If one of the trading charts are not in sync with one another you are in consolidation. 2: If the Daily ROMAR/EMA are not sync with 1 and 2 hour charts you are in consolidation.
Rules for consolidation: a: The 2 hour is your trading/trend chart. b: Use the Daily Chart S/R as reference for consolidation. c: You can trade either short or long in consolidation. d: Trade from resistance to support and vice-versa. Do not trade from center in consolidation. e: Both upper and lower bands are resistance and support in consolidation.
Last DB Attachment –top at 0 fibo H2, purple crossed white I'm looking for a sale. But trend Romar/EMA and Parabolic trend for shopping and H2 have a one divergence.
Either I will find a way, or I will make one...
 
 
  • Post #15,233
  • Quote
  • Edited 6:25am Feb 4, 2019 3:02am | Edited 6:25am
  •  Lakers
  • | Joined Dec 2018 | Status: Member | 312 Posts
Thanks Dana for all the recent lessons.
February 4th, 2019 EUR/JPY.
Session: London
Red News: none

Daily
Romar: Resistance
EMA: Support
Parabolic: Support
Fibs: Green
EMA last arrow: UP, MACD: UP
Note: The market opened above Purple. EMA and the 4 horsemen are for the up and are going against Romar resistance.
H4
Romar: Support
EMA: Support
Parabolic: Support
Fibs: Red
Note: Everything is pointing for the up.
H2
Romar: Support
EMA: Support
Parabolic: Support
Fibs: Green (edited) Fibs: Red
EMA last arrow: UP, MACD: UP
Note: Everything is pointing for the up. But White Purple has crossed.
H1
Romar: Support
EMA: Support
Parabolic: Support
Fibs: Red
Note: In sync for the up with H2.

Final note:
The EMA / Parabolic trend on the charts are for the up and are going against the Daily Romar resistance.
Projected entry:
Look to buy if the market goes to support with confluence and EMA shows a slider.
Can also consider shorting if the markets goes to at least the Daily Romar resistance.
Trend Support/Resistance
 
 
  • Post #15,234
  • Quote
  • Feb 4, 2019 3:10am Feb 4, 2019 3:10am
  •  Iris2018
  • | Joined Nov 2018 | Status: Member | 385 Posts
With the opening of London to enter purchases no 40 points to 0 fibo. Waiting for a rollback to the EMA (or parabolic, preferably SAR).
To enter the sale you need a slider and the opening of the candle below the EMA (level 23, 6 fibo) and 40 pips before Romar.
Watching the next candle
Either I will find a way, or I will make one...
 
 
  • Post #15,235
  • Quote
  • Feb 4, 2019 5:10am Feb 4, 2019 5:10am
  •  Iris2018
  • | Joined Nov 2018 | Status: Member | 385 Posts
Note: the price has set a new maximum. DB uncovered two divers at 0 fibo. Waiting for the next bar
Either I will find a way, or I will make one...
 
 
  • Post #15,236
  • Quote
  • Feb 4, 2019 1:02pm Feb 4, 2019 1:02pm
  •  Lakers
  • | Joined Dec 2018 | Status: Member | 312 Posts
Quoting Lakers
Disliked
Thanks Dana for all the recent lessons. February 4th, 2019 EUR/JPY. Session: London Red News: none Daily Romar: Resistance EMA: Support Parabolic: Support Fibs: Green EMA last arrow: UP, MACD: UP Note: The market opened above Purple. EMA and the 4 horsemen are for the up and are going against Romar resistance. H4 Romar: Support EMA: Support Parabolic: Support Fibs: Red Note: Everything is pointing for the up. H2 Romar: Support EMA: Support Parabolic: Support Fibs: Green (edited) Fibs: Red EMA last arrow: UP, MACD: UP Note: Everything is pointing...
Ignored
Entry
Long
The Daily H2 H4 Parabolic trend is for the up going against the Daily Romar resistance. H1 H2 H4 Fibs Red, when the market is trending for the up the Fibs will be Red so the market can push Fibs Red '0' higher until the end of the trend and Red 23.6 is support when trending for the up.
H2 SAR showing on 23.6 support confluence with H1 H4 23.6 support. TP is before Daily Romar resistance.

Attached Image (click to enlarge)
Click to Enlarge

Name: Screenshot1.png
Size: 67 KB
Trend Support/Resistance
 
1
  • Post #15,237
  • Quote
  • Feb 4, 2019 1:50pm Feb 4, 2019 1:50pm
  •  dove_alliance
  • Joined Jun 2007 | Status: Trading Live For The Last 14 Years. | 5,761 Posts
Quoting Lakers
Disliked
{quote} Entry Long The Daily H2 H4 Parabolic trend is for the up going against the Daily Romar resistance. H1 H2 H4 Fibs Red, when the market is trending for the up the Fibs will be Red so the market can push Fibs Red '0' higher until the end of the trend and Red 23.6 is support when trending for the up. H2 SAR showing on 23.6 support confluence with H1 H4 23.6 support. TP is before Daily Romar resistance. {image}
Ignored
What did I say about the 23.6 being BOTH support and resistance? What must happen before any entry at the 23.6 and the 61.8 can be taken? You must follow the rules to trade without risk. You also entered a trade going long with the Red EMA Arrow for a short before the MACD. What is the rule on the EMA Arrow and MACD Arrows? These are rules must be followed to be successful.

You got a Red Fibo on all three trading charts and you want to go long. You are being analytical once again and not following the rules of trading. So let your trade run and see what happens at the 23.6. You got just over an hour left on the H4.
The Dove - Forex Trainer
 
5
  • Post #15,238
  • Quote
  • Feb 4, 2019 3:11pm Feb 4, 2019 3:11pm
  •  dove_alliance
  • Joined Jun 2007 | Status: Trading Live For The Last 14 Years. | 5,761 Posts
While this bar is finishing out, Lakers; I will bring the visual in what is happening with your trade. Here is your entry chart:
Attached Image (click to enlarge)
Click to Enlarge

Name: Lakers Entry 01-04-19.png
Size: 67 KB

As you noticed you assumed this will continue to the Daily ROMAR. To begin with you never, ever assume anything with The Paradox. You also assumed your bar entry will hit the H2 23.6 as support. With your entry you have a RED bar previous with your entry and DB connected on top. You also had an open bar at EMA below Smooth. These visual is telling you there is major risk for ANY TRADE.

The reason why is because the DB being on top with Divergences, The question is what will happen if the Market gets below the 23.6 of the Fibo? During this write up you have the EMA Arrow in and/out and the MACD showing up on this next bar at the zero line. By assuming your trade is in a major risk. The biggest risk is being in a slider or a reversal; and if the 23.6 is broken down it will go.

On your trading plans I have not ever seen the risk for your trades. I suggest when you create your trading plans to also include the risk for your entries. This will help you in not assuming anything.

Just let your trade run it course in case you get lucky the 23.6 will not be broken.
The Dove - Forex Trainer
 
5
  • Post #15,239
  • Quote
  • Feb 4, 2019 6:14pm Feb 4, 2019 6:14pm
  •  The-Force
  • | Joined Jul 2017 | Status: Member | 124 Posts
Hello everyone and thank you Dove for your recent posts about the 23.6 and 61.8 of the Fibs. It was very impressive back on the Jan 30th how the market went down to H4 23.6 Sup and then back up to H2 23.6 Res and then down the market went! And also your post about the Daily balance @ 125.716. I don’t fully understand this yet but im not going to get hung up on it.

Trading plan for
2019-02-24
News. Red news at 8am

Daily;
ROMAR- Res
EMA- Sup
PSAR- Sup
EMA arrow- Up
MACD arrow UP
Fib- Green

Notes; Consolidation with ROMAR
Standard and hidden Divergence on top with DB. At the moment purple support is about 33pips and EMA is about 71pips away from the market


4H;
ROMAR- Sup
EMA- Sup
PSAR-Sup
Fib- Red

Notes;
Purple x White. Standard and hidden Divergence at the top with DB


2H;
ROMAR- Sup
EMA- Sup
PSAR- Sup
EMA arrow- Up
MACD arrow- Down
Fib-Red

Notes;
Market hit 23.6 support with Sar. Standard and hidden Div at the top with DB. Red EMA arrow blinking on and off. Purple x Smooth

1H;
ROMAR-Sup
EMA- Res
PSAR-Res
EMA arrow- Down

MACD arrow- Down
Fib- Red
Notes;
61.8 about 51 pips from market

Final notes; Market is in Consolidation. Trade in the moment with room to support or resistance
 
 
  • Post #15,240
  • Quote
  • Feb 4, 2019 6:59pm Feb 4, 2019 6:59pm
  •  SuchParadox
  • Joined Feb 2018 | Status: Member | 289 Posts
EURJPY Date: 05/02/19
News: USD News 3pm GMT

Daily:
ROMAR: Resistance
EMA: Support
PSAR: Support

Checklist:

Last MACD 0 crossing: up
Lat EMA alert arrow: up
Last DB attachment: up, 125.936, 20 pips from Romar resistance
Fibo: green and up

Notes: 4hm turned up, Romar resistance 45 pips away. Green divergence attached to the top of current daily bar. BB’s opening up. Daily in a consolidated uptrend , with Romar as resistance, 4hm as support.


4HR:

ROMAR: Support
EMA: Support
PSAR: Support

Checklist:

Last MACD 0 crossing: up
Last DB attachment: top, 125.936 at the 0.0 fibo creating higher highs in uptrend.
Fibo: Red and down

Notes: 4hm turned up, with white and purple currently sliding against each other indicating the potential beginning of a swing down, if purple/white hold resistance in the moment. Psar support 56 pips away from current price.


2HR:
Opening Price: 125.650
ROMAR: Support
EMA: Support
PSAR: Support

Checklist:

Last MACD 0 crossing: down
Lat EMA alert arrow: up
Last DB attachment: same as h4, with both divergence and magenta tag
Fibo: Red and down

Notes: 4hm turning down, putting h2 chart in consolidation. Several elements conflicting with the current uptrend such as macd turning down, fibo red, both divergences attached to the high and most importantly, purple crossing smooth down, for a swing down. We had psar attached at the 23.6 fibo, holding support. However currently purple/smooth holding resistance. BB’s closing in.

1HR:

ROMAR: Support
EMA: Resistance
PSAR: Resistance

Checklist:

Last MACD 0 crossing: down
Lat EMA alert arrow: up, previous bar
Fibo: red and down

Notes: 4hm turning back up with purple sliding against white, after a shallow swing down. Psar holding resistance, 4hm moving closer together indicating a tight consolidation with bb’s closing in. Romar support out of trading range.


Final Notes:h1 turned down, h2 turning down for a swing in consolidation, h4 up and daily turned up. We are in a consolidated uptrend, with certain elements on h1 and h2 conflicting with the uptrend and starting to show the beginning of a downswing. Currently the risk is too high to enter a trade, But I’m looking to go short, if h1 psar holds resistance, along with 4hm on h2/h4. Ideal short entry would be right against h2 4hm as resistance,with a fixed ema down arrow , as there would be less risk for 40tp to hit. If however, h4m are broken as resistance, and h1 continues to turn up, I will reconsider the trade, based on any adjustments.

Adjustments: H2 open above 4hm, with daily open in the middle of romar and purple support. If I want to short I will wait for a hit on daily Romar before doing so, as we are still in consolidation. and in consolidation, trading is both ways, from support or resistance.
 
 
  • Trading Systems
  • /
  • The Paradox System
  • Reply to Thread
    • 1 760761Page 762763764 863
    • 1 Page 762 863
2 members viewing:
Bsverma
,
SeriTrade
  • More
Top of Page
  • Facebook
  • Twitter
About FF
  • Mission
  • Products
  • User Guide
  • Media Kit
  • Blog
  • Contact
FF Products
  • Forums
  • Trades
  • Calendar
  • News
  • Market
  • Brokers
  • Trade Explorer
FF Website
  • Homepage
  • Search
  • Members
  • Report a Bug
Follow FF
  • Facebook
  • Twitter

FF Sister Sites:

  • Metals Mine
  • Energy EXCH
  • Crypto Craft

Forex Factory® is a brand of Fair Economy, Inc.

Terms of Service / ©2023