I have played around with this for about a month, and as you can see from the TE, it is currently in profit. It would have been more profit, if I had used the 2% on all trades, but I started out simply on 0.01 lots, without worrying too much about risk/reward, as it was testing out purely the capability of the system. I then found an EA that allowed me to simply punch in sell or buy at a set amount or risk.
The backtest was quite positive, both a visual backtest… plotting S/R lines etc and manually saying I would do this or I would do that… hardly the most scientific or subjective way of testing, so I entered the forward testing phase of just testing out my expectations. They were to a large extent met with the results quite encouraging… although I would say that 2 trades went to almost full profit and reversed – I will cover what I should have done, and what I plan to do further in my trading plan below. Ultimately though, they should have both had better results, but this is even more encouraging, as the profit could have been higher.
In total I have had 15 trades – it is currently showing 17, but one was an accidental entry into a trade that was exited immediately. One was a trade I just simply should not have taken.
What am I planning to do now?
I plan to forward test my strategy for 1 year. I am going to reset the TE so it is right from day 1.
The most important aspect is going add comments into the order itself…
The reason being is that I plan to trade on the 1h, 4h and 1d charts… and it is going to be very important (to me) to know how the different timescales behave… if I can filter the trades of the comments… simply a 1h, 4h, or 1d note will be very important to see the change of timescale p/l
Of course the TE will only show the cumulative trades regardless of tf.
The simple premise is as follows:
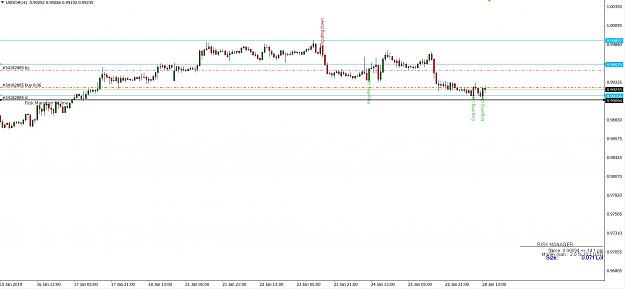
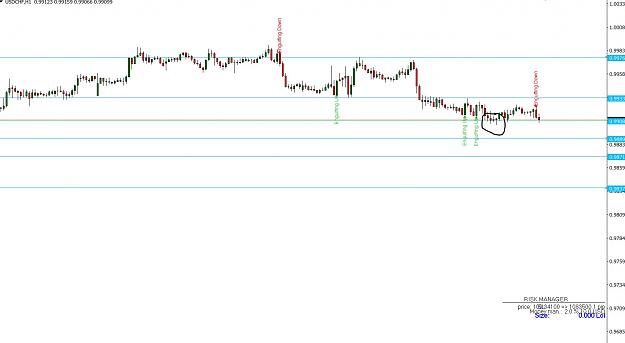
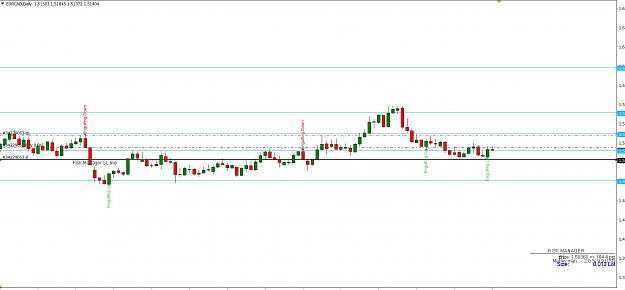
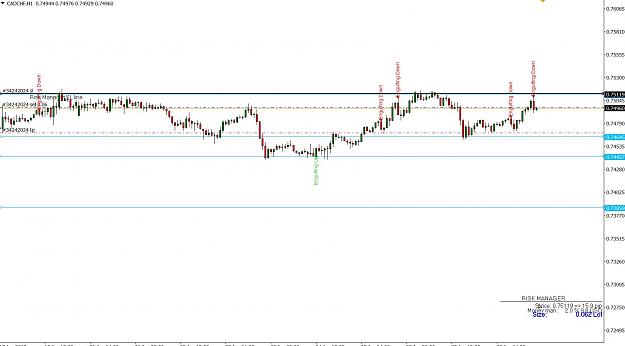
Pre requisite: Draw S/R lines at least 2 above and 2 below current price. These need to be OBVIOUS S/R lines…
Chart t/f will be 1h, 4, 1d - 15 min timeframe just seems to eat away all meaningful profit for this strategy.. something i am not willing to give way on a smaller timeframe!
Entry of a buy:
Engulfing candle at bounce of S/R line. Candle needs to close above the Support line for it to be valid.
Candle needs to have a short tail, and the body needs to be largely on the right side of the support line.
What do I mean by this? A large candle… either with big wicks or big bodies are discounted. So if they run through a couple of s/r lines, then it is not a valid entry. I
just find these to lack the certainty of profit… although this is something I will track.
R:R needs to be more than 1:1. I am reasonably confident that a 1:1 risk reward is feasible, as if it goes to 1:1.1, then there is an edge there that can be capitalised on. The R:R can be much greater though, so anything bigger is a bonus.
SL is a couple of ‘visual’ pips below last candle low, or nearest support line. So if the forming candle goes through the s/r line, then it is deemed to have a SL below the candle wick. If it did not go through the s/r line, then SL will be below the support line.
Exits:
Tp will be below the next resistance line.
SL will be the SL.
We can change the SL ONLY when we are a couple of pips away form the TP level, or once the price hits 50% of our TP, we can take the risk element away and lock in a couple of pips.
This is about capital retention..
Entry of a Sell:
The exact same as above, but reversed.
Chart selection is predominantly (Major) forex pairs, Silver, Gold, but this could be expanded to most commodities. Not sure how it would work on futures, as I don’t know enough about them… especially when we are trading daily charts… do they run out of time and your investment turns to zero like options??? Not sure!!!
All trades will risk 2% of account. My standard leverage is 1:30, however, if the Daily charts get going, you may want to up the leverage… remember, this does not change your overall risk… you are still only risking 2% of your account, but the leverage gives you the ability to have more trades open. This is not a bad thing, based on this being a numbers game…
We expect to win 55% of trades, we expect to have 1:1 (or higher) Risk:Reward. Our edge is winning more than we lose, and that our wins have a bigger R;R than our losers… ie we can have a bigger R:R than 1:1… so 1:1.5, 1:2, 1:4 etc etc… however we will NEVER have a bigger risk than reward… ie 2:1, 3:1 etc
The good thing, is that if we drop below a 55% win to loser ratio, is that we could also increase our Risk to reward edge. As I say, it will never go below 1:1.
Expectations:
I expect that we will have about 10-20 trades per month, but do not expect to trade EVERY day.
I expect that this will be a low impact approach to the markets
I expect that we may be in the red in pips (daily chart versus 1 hr charts….)
I expect that we will be in the green in pips.
As mentioned, I want to forward test for 1 year.
Check points will be monthly – so a good solid analysis of every trade taken (and not taken, so every signal to be recorded if taken or not) to report on how we could improve the strategy, trade management.
I am going to try to post every trade (it may be after the event in terms of photos) and how it pans out. Either way, it will be fully verifiable on the TE.
Once the TE is started, it will be locked… as in it will not be restarted or modified.
All mistakes will be recorded… There could be a debate over whether the TE looks at the trade plan or the trader, but in this case, I am looking at it as the TE is looking at MY trading – emotionally, and just pure capability.
Just to point out, I do use an indicator that shows the engulfing bars. The engulfing bars are set to how I want them to be, so if you were to look at the same chart, you may interpret them differently to mine- and that is OK.
The backtest was quite positive, both a visual backtest… plotting S/R lines etc and manually saying I would do this or I would do that… hardly the most scientific or subjective way of testing, so I entered the forward testing phase of just testing out my expectations. They were to a large extent met with the results quite encouraging… although I would say that 2 trades went to almost full profit and reversed – I will cover what I should have done, and what I plan to do further in my trading plan below. Ultimately though, they should have both had better results, but this is even more encouraging, as the profit could have been higher.
In total I have had 15 trades – it is currently showing 17, but one was an accidental entry into a trade that was exited immediately. One was a trade I just simply should not have taken.
What am I planning to do now?
I plan to forward test my strategy for 1 year. I am going to reset the TE so it is right from day 1.
The most important aspect is going add comments into the order itself…
The reason being is that I plan to trade on the 1h, 4h and 1d charts… and it is going to be very important (to me) to know how the different timescales behave… if I can filter the trades of the comments… simply a 1h, 4h, or 1d note will be very important to see the change of timescale p/l
Of course the TE will only show the cumulative trades regardless of tf.
The simple premise is as follows:
Pre requisite: Draw S/R lines at least 2 above and 2 below current price. These need to be OBVIOUS S/R lines…
Chart t/f will be 1h, 4, 1d - 15 min timeframe just seems to eat away all meaningful profit for this strategy.. something i am not willing to give way on a smaller timeframe!
Entry of a buy:
Engulfing candle at bounce of S/R line. Candle needs to close above the Support line for it to be valid.
Candle needs to have a short tail, and the body needs to be largely on the right side of the support line.
What do I mean by this? A large candle… either with big wicks or big bodies are discounted. So if they run through a couple of s/r lines, then it is not a valid entry. I
just find these to lack the certainty of profit… although this is something I will track.
R:R needs to be more than 1:1. I am reasonably confident that a 1:1 risk reward is feasible, as if it goes to 1:1.1, then there is an edge there that can be capitalised on. The R:R can be much greater though, so anything bigger is a bonus.
SL is a couple of ‘visual’ pips below last candle low, or nearest support line. So if the forming candle goes through the s/r line, then it is deemed to have a SL below the candle wick. If it did not go through the s/r line, then SL will be below the support line.
Exits:
Tp will be below the next resistance line.
SL will be the SL.
We can change the SL ONLY when we are a couple of pips away form the TP level, or once the price hits 50% of our TP, we can take the risk element away and lock in a couple of pips.
This is about capital retention..
Entry of a Sell:
The exact same as above, but reversed.
Chart selection is predominantly (Major) forex pairs, Silver, Gold, but this could be expanded to most commodities. Not sure how it would work on futures, as I don’t know enough about them… especially when we are trading daily charts… do they run out of time and your investment turns to zero like options??? Not sure!!!
All trades will risk 2% of account. My standard leverage is 1:30, however, if the Daily charts get going, you may want to up the leverage… remember, this does not change your overall risk… you are still only risking 2% of your account, but the leverage gives you the ability to have more trades open. This is not a bad thing, based on this being a numbers game…
We expect to win 55% of trades, we expect to have 1:1 (or higher) Risk:Reward. Our edge is winning more than we lose, and that our wins have a bigger R;R than our losers… ie we can have a bigger R:R than 1:1… so 1:1.5, 1:2, 1:4 etc etc… however we will NEVER have a bigger risk than reward… ie 2:1, 3:1 etc
The good thing, is that if we drop below a 55% win to loser ratio, is that we could also increase our Risk to reward edge. As I say, it will never go below 1:1.
Expectations:
I expect that we will have about 10-20 trades per month, but do not expect to trade EVERY day.
I expect that this will be a low impact approach to the markets
I expect that we may be in the red in pips (daily chart versus 1 hr charts….)
I expect that we will be in the green in pips.
As mentioned, I want to forward test for 1 year.
Check points will be monthly – so a good solid analysis of every trade taken (and not taken, so every signal to be recorded if taken or not) to report on how we could improve the strategy, trade management.
I am going to try to post every trade (it may be after the event in terms of photos) and how it pans out. Either way, it will be fully verifiable on the TE.
Once the TE is started, it will be locked… as in it will not be restarted or modified.
All mistakes will be recorded… There could be a debate over whether the TE looks at the trade plan or the trader, but in this case, I am looking at it as the TE is looking at MY trading – emotionally, and just pure capability.
Just to point out, I do use an indicator that shows the engulfing bars. The engulfing bars are set to how I want them to be, so if you were to look at the same chart, you may interpret them differently to mine- and that is OK.