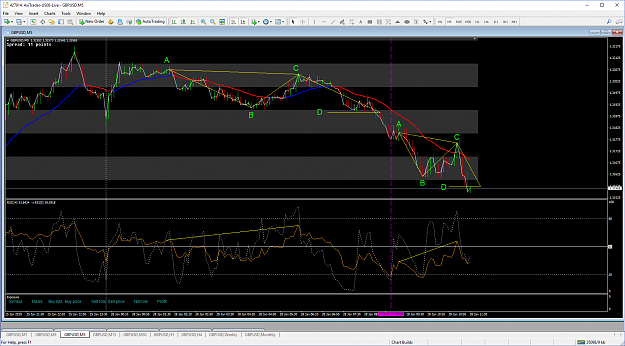
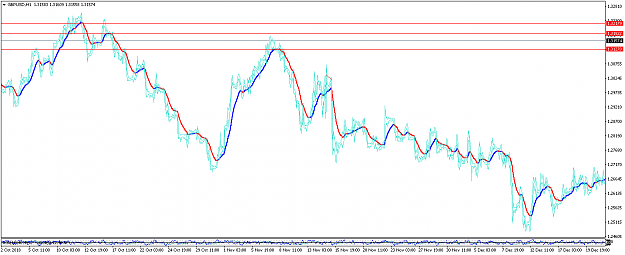
If we look at the weekly chart it puzzles me a tad because it can be drawn like this, indicating a short is due. {image} Or like this ( Yellow ) {image} Or even like this which I suspect is the right way.. {image} One thing is for sure I am not going to wait 4, 8, 12 hours to find out.
Ignored
Hi Alan,
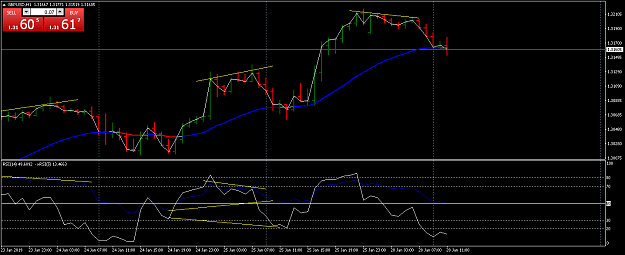
This is one of the spots I'm struggling with tbh. Whenever we have such situations (which is not rare at all), how do we pick the right high (or low in uptrend) to draw the beginning of the divergence from (in this case there are 3 possibilities)? In hindsight it's easy, but when trading in real time it isn't and we might end up losing a few trades along the way.
Any tips and insight would be greatly appreciated. Thanks and wishing you a great week ahead.
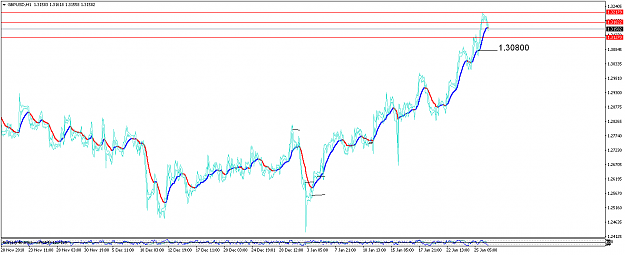
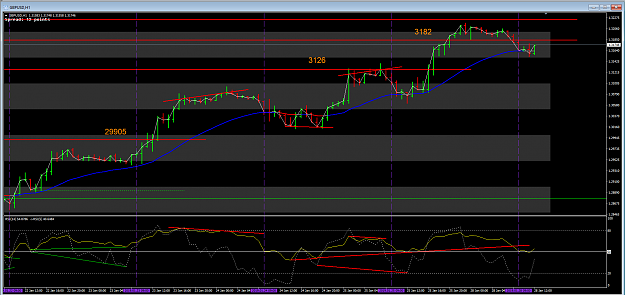
{quote} Is this wrong then? edit sorry I thought you were talking about the swing average target {image}
Ignored
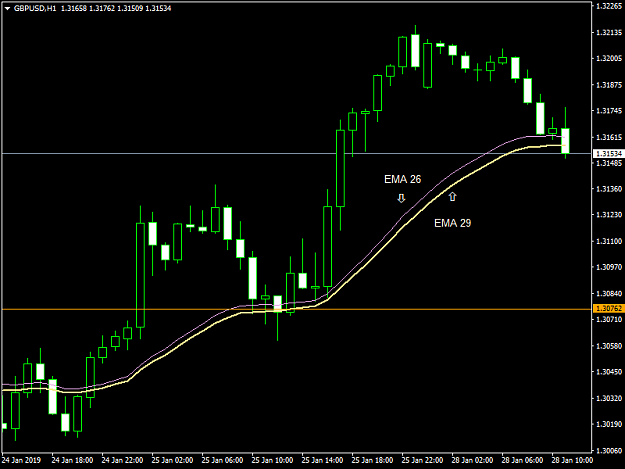
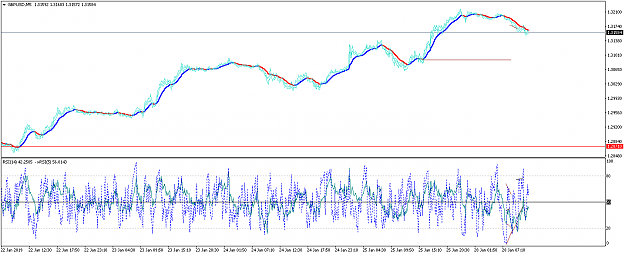
Here we are. As you can see from the chart below, the difference is not much between EMA 26 and EMA 29 but I am more comfortable with the latter as I monitor all the TFs at the same time
{quote} Hi Alan, This is one of the spots I'm struggling with tbh. Whenever we have such situations (which is not rare at all), how do we pick the right high (or low in uptrend) to draw the beginning of the divergence from (in this case there are 3 possibilities)? In hindsight it's easy, but when trading in real time it isn't and we might end up losing a few trades along the way. Any tips and insight would be greatly appreciated. Thanks and wishing you a great week ahead.
Ignored
OK first off the highest times frame are not of much use to us most of the time.
Best to stick with the 1 hour and the 5 minute.
What inference did we see on the 1 hour chart?
What signal did we see on the 5 min that will attempt this inference?
Best if you try to answer this instead of me telling you.
{quote} Here we are. As you can see from the chart below, the difference is not much between EMA 26 and EMA 29 but I am more comfortable with the latter as I monitor all the TFs at the same time {image}
{quote} OK first off the highest times frame are not of much use to us most of the time. Best to stick with the 1 hour and the 5 minute. What inference did we see on the 1 hour chart? What signal did we see on the 5 min that will attempt this inference? Best if you try to answer this instead of me telling you.
Ignored
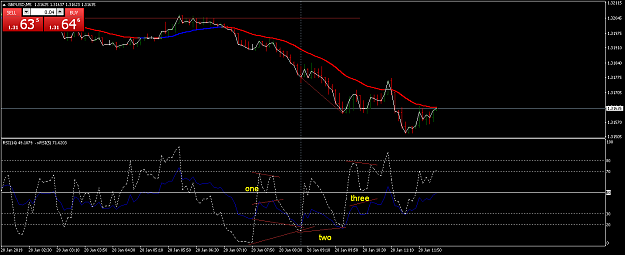
I couldn't see any div on the 60 min, except a return to the 60 min ema after it happened of course, maybe you can see something
Attached Image (click to enlarge)
life is a reflection of what we allow ourselves to see
{quote} To me both are valid. Meanwhile, am looking at the Alan div on M30 and am wondering if H1 average will usher in the bulls as it did last Friday. By the way, I have exited my shorts at 3151
Ignored
All averages are valid it doesn't matter what number you use price will always attract them to itself.
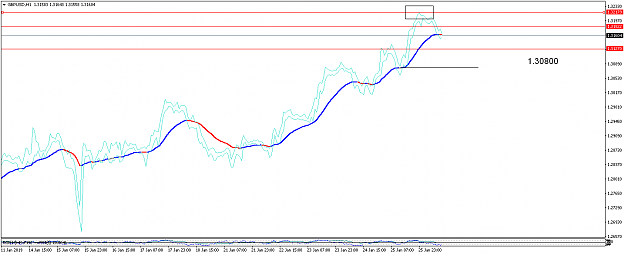
There we go... {image} These continuation divergences A - C form measured moves of AB = CD. Where D is a support to be broken and becomes a resistance then.
Ignored
Great to see the Continuation Divergences again ... From memory the reason the 2nd one started from where it did is because it was the 1st point/pivot/fractal that formed after the 1st one had completed (hit or exceeded it's Pt) that we can use to look for a new setup (The 2nd continuation divergence)
{quote} Great to see the Continuation Divergences again ... From memory the reason the 2nd one started from where it did is because it was the 1st point/pivot/fractal that formed after the 1st one had completed (hit or exceeded it's Pt) that we can use to look for a new setup (The 2nd continuation divergence)
Ignored
Ha Ha Ha what are you trying to do, blow peoples minds up.