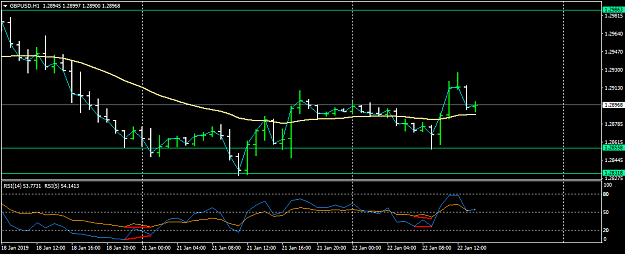
{quote} I saw that DIV on the 1HR and went long but entered late , just sold at 1.29110, cant post charts at the moment as im on my phone
Ignored
Why would you initiate a sell? Nothing tells us (at the time you sold) that there is a sell according to the rules by the OP. Or am I missing something?
{quote} Why would you initiate a sell? Nothing tells us (at the time you sold) that there is a sell according to the rules by the OP. Or am I missing something?
Ignored
No I mean I'm out, yes your right I didn't see a div on the 5 , but I got stopped out twice (earlier) and got my money back
life is a reflection of what we allow ourselves to see
{quote} David, what you have marked on your H1 chart is not an Alan divergence, but a regular bullish hidden divergence that normal RSI practitioners use. Alan's divergence is one where the RSI14 and RSI5 show divergence between them. The Alan's divergence on the H1 TF in this case came in here: {image} Hope this helps. PS: Apologies, I was looking at Bydyke's chart when commenting on yours. At the time there was Alan's divergence when you drew it, correct. This is one of the situations I was referring to earlier in my posts to Alan, but guess I...
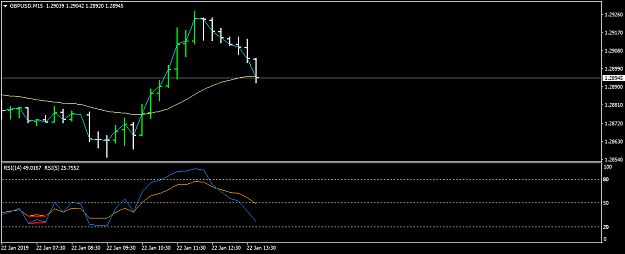
I tried to apply your standards as below:
- Timing: after bar 108
- Inference: H1 RSI div right on average low swing
- Entry: Plenty of time for putting on 3 stage entries
- Target: well enough within 40 pips range
Thank you Alan
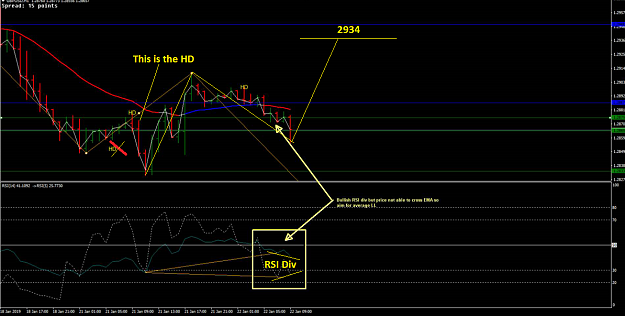
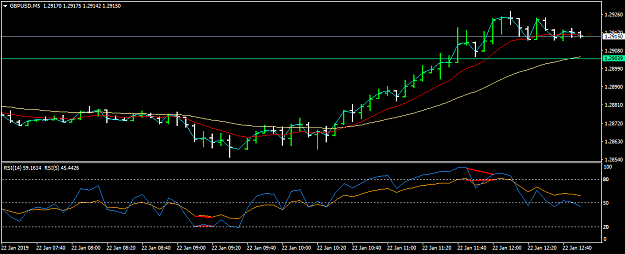
Quiet here today. Am currently short despite bullish RSI div. on hour chart. {image} Hope my understanding is correct Alan in that since bulls failed at EMA I was looking for shorts on 5 min targeting the avg LL. 5m short on 09h00 candle as HD was present. Hedged at 09h25 upon bullish RSI div.
Ignored
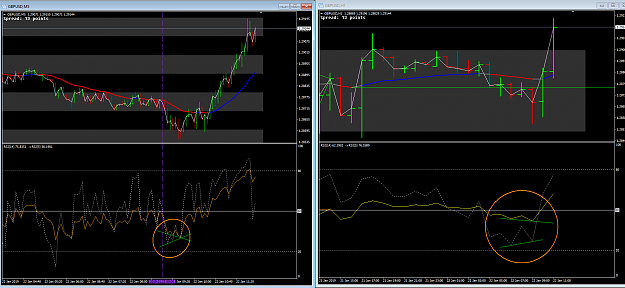
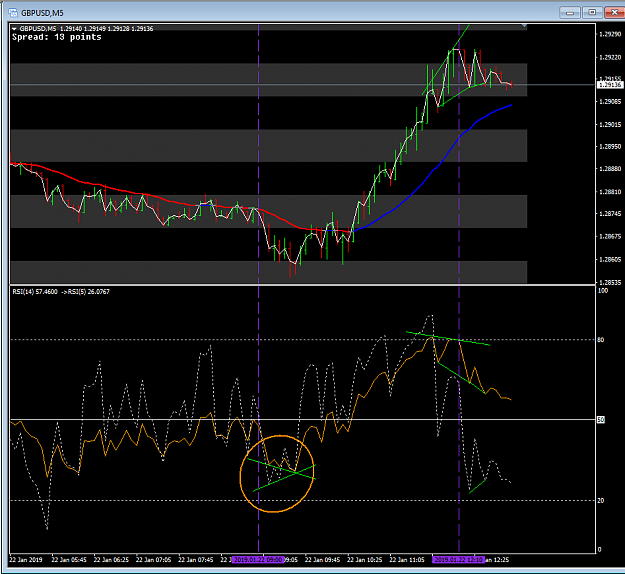
From your drawing David is seems you are not understanding the HD's correctly. Below is your chart with the corrections on it.
The first HD you had was a nothing
The next one was on the wrong bar.
The third one was OK
The AB = CD was drawn wrong
You missed the RSI Div at the appropriate time.
{quote} I tried to apply your standards as below: - Timing: after bar 108 - Inference: H1 RSI div right on average low swing - Entry: Plenty of time for putting on 3 stage entries - Target: well enough within 40 pips range Thank you Alan
Ignored
Just watch the timing if the inference comes a tad early or a tad late we still have to wait for it.
{quote} From your drawing David is seems you are not understanding the HD's correctly. Below is your chart with the corrections on it. The first HD you had was a nothing The next one was on the wrong bar. The third one was OK The AB = CD was drawn wrong You missed the RSI Div at the appropriate time. {image}
How do I get my fast RSI to look like yours exactly? This is how I inputted:
1. From the indicator list, I upload the Relative Strength Index. I notice that at this point it does not show ‘previous indicator’s data.’ It is only after you have uploaded this RSI and click on it to check the details that you can now see ‘previous indicator’s data’ but there is no way to overlay it on the original one
2. Then from the Navigator side I drag RSI to the one above. Here, there is no provision here for 'previous indicator's data'
So, is there something you are doing that I am not getting right.
Apart from Alan, I will appreciate any assistance from you guys too
{quote} How do I get my fast RSI to look like yours exactly? This is how I inputted: 1. From the indicator list, I upload the Relative Strength Index. I notice that at this point it does not show ‘previous indicator’s data.’ It is only after you have uploaded this RSI and click on it to check the details that you can now see ‘previous indicator’s data’ but there is no way to overlay it on the original one 2. Then from the Navigator side I drag RSI to the one above. Here, there is no provision here for 'previous indicator's data' So, is there something...
{quote} It could be that on the 1 hour the bulls are looking for support.
Ignored
Yes, it's looking like it. The last bullish H4 candle is in agreement.
But cable is capable of anything. Since yesterday, despite the positive signals, GU has sort of, been avoiding the 2900 area. So, I won't be surprised if it makes a big move southwards before the obvious ascent