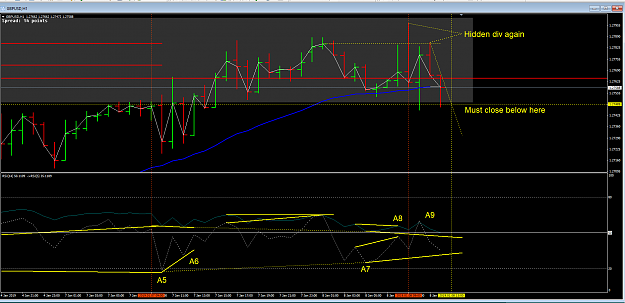
Thanks for all the charts and replies guys, it's really great to see everyones points of view, definitely helps with the learning process. I have posted 3 charts with my attempt at interpreting the situation, please feel free to criticise. The one hour has a regular divergence, price is at the ema indicating indecision but the trend is up so we should still be aware of bullish (or should we be really looking for shorts or waiting for the ema to cross because of the bear div) the rsi is above the 50 The 15m has a bounce off the 1 hour ema with a...
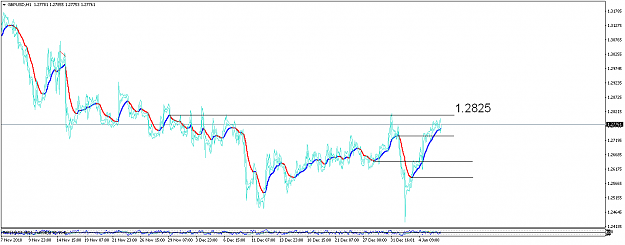
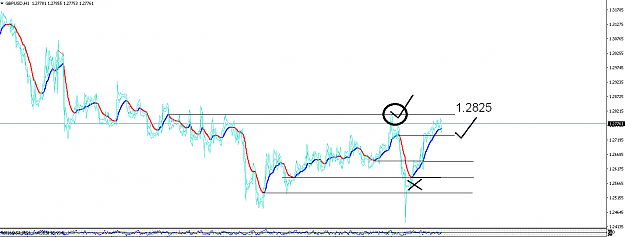
It has already been there and done that but failed to make the EMA swing high so it tests the opposite direct and made an EMA double bottom where it fails to make the EMA LL so again it turns to make the EMA swing high and does so.
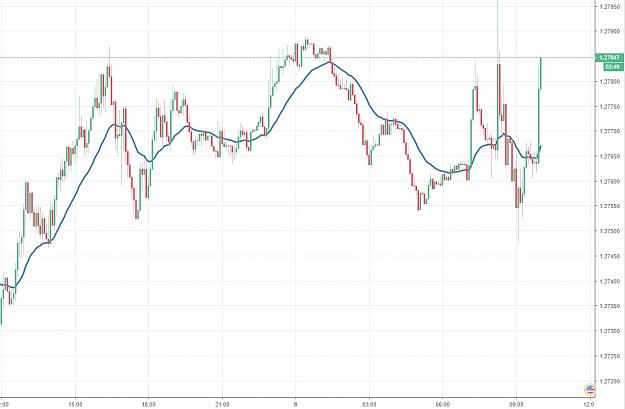
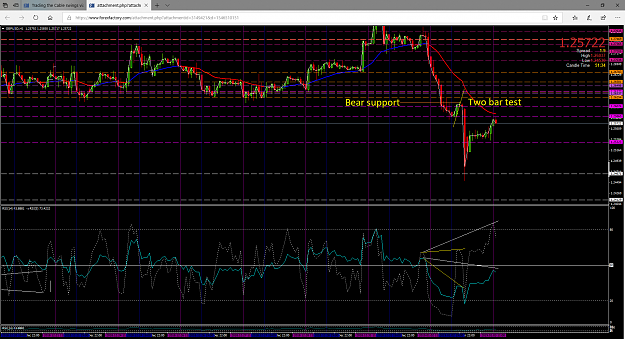
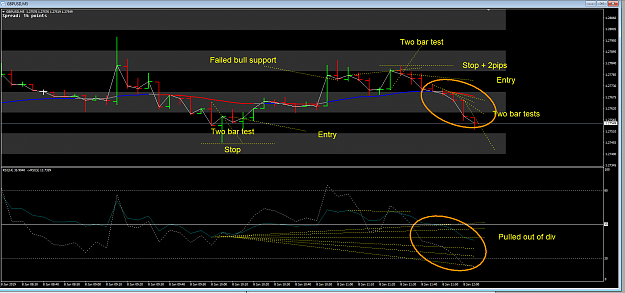
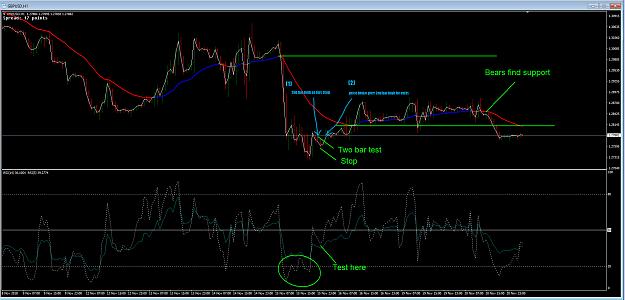
See how on this 5 min chart how the bears pushed down and out of the bullish divergences and how the application of the two bar tests keep us out of trouble by not taking longs.
See how on this 5 min chart how the bears pushed down and out of the bullish divergences and how the application of the two bar tests keep us out of trouble by not taking longs. {image}
Ignored
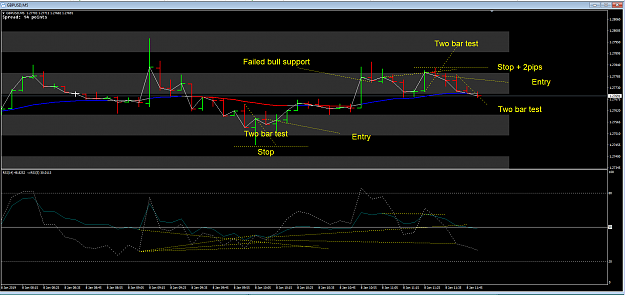
thats interesting, what parameters do you use to determine the top or bottom line for a 2 bar test, or is it just a straight line - same height as the first starting bar ( thats what it looks like from the chart)
life is a reflection of what we allow ourselves to see
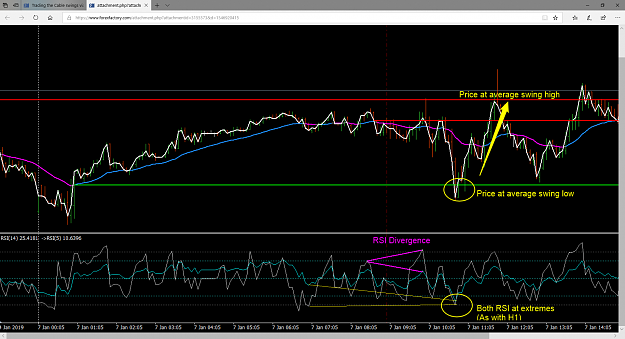
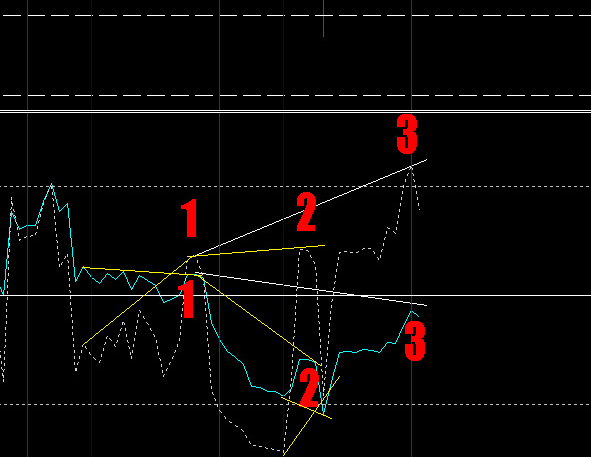
{quote} The answer to this was no because you have the lines(white) drawn incorrectly, consider this... 3155934 It is important not to chop off pivots just o make a line fit {image}
Ignored
Hi Alan,
Blessed New Year to You and Your Family. Welcome Back!
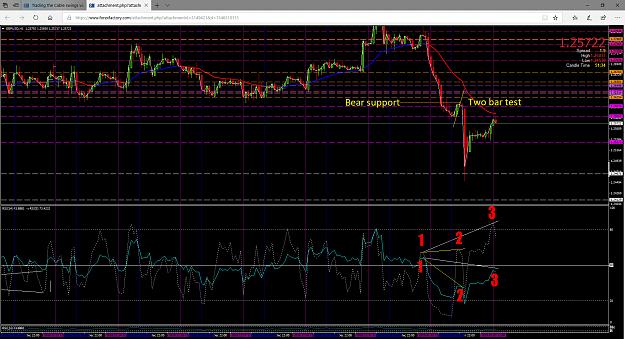
Can you please elaborate more on "It is important not to chop off pivots".
Do you mean... (see picture) If Point 1 on the RSI is used to mark a div on Point 2; then Point 1 cannot be used again to mark Point 3?
{quote} Hi Alan, Blessed New Year to You and Your Family. Welcome Back! Can you please elaborate more on "It is important not to chop off pivots". Do you mean... (see picture) If Point 1 on the RSI is used to mark a div on Point 2; then Point 1 cannot be used again to mark Point 3? Please advise, thanks. {image}
Ignored
I do beg your pardon you do have the lines correct, I am the one cracking up.
{quote} thats interesting, what parameters do you use to determine the top or bottom line for a 2 bar test, or is it just a straight line - same height as the first starting bar ( thats what it looks like from the chart)
Ignored
I have the same question..... this is my understanding from post 63, I hope I am right.