Inserted Video
Similar Threads
Whats your best money management method? 52 replies
How to flow with the order flow? 26 replies
Money Management / Risk Management 24 replies
Money management model for multiple strategy trading method 16 replies
Most popular money management method. 7 replies
 Money Flow Trading Method along with Risk Management
- #5,162
- Jan 4, 2019 6:49am Jan 4, 2019 6:49am
- | Commercial User | Joined Dec 2014 | 14,163 Posts
Attached Image (click to enlarge)

- #5,164
- Jan 4, 2019 7:53am Jan 4, 2019 7:53am
- | Commercial User | Joined Dec 2014 | 14,163 Posts
https://www.zerohedge.com/news/2019-...ops+to+zero%29
Jobs Blowout: December Payrolls Soar By 312K As Wages Jump Most Since 2009
https://www.zerohedge.com/sites/defa...?itok=LY4e264-
by Tyler Durden
Fri, 01/04/2019 - 08:41
In our preview of the December payrolls report, we said that the big risk is a big upside surprise in the form of "good news being bad news", and sure enough, and that's precisely what happened when the BLS reported that in December the US added a whopping 312K jobs, far above the 184K expected, and the highest since February 2018. The total number of payrolls surged above 150 million for the first time ever, to 150.263 million to be specific.
https://www.zerohedge.com/sites/defa...dec%202018.jpg
Meanwhile, November's print was revised up from +155,000 to +176,000, and the change for October was revised up from +237,000 to +274,000. With these revisions, employment gains in October and November combined were 58,000 more than
previously reported. After revisions, job gains have averaged 254,000 per month over the last 3 months.
Putting the number in context, this was the biggest beat since June 2016... which may not be such a good thing as the last 2 big beats both saw a big plunge the next month.
https://www.zerohedge.com/sites/defa...%20%282%29.jpg
Looking at some sectors:
- Oil and gas extraction payrolls rose 10,200 from a year earlier.
- Gasoline stations payrolls rose 1,300 in Dec. after rising 1,800 in Nov.
- Pipeline transport payrolls fell 200 in Dec. after falling 200 in Nov.
- Petroleum and coal payrolls rose 1,300 in Dec. after falling 1,100 in Nov.
It wasn't just the scorching payrolls number, but also the average hourly earnings print, which jumped by 3.2%, higher than both the November 3.1% and the 3.0% consensus; in fact it was the highest number since April 2009!
https://www.zerohedge.com/sites/defa...2019-01-04.jpg
The unemployment rate rose from 3.7% to 3.9%...
https://www.zerohedge.com/sites/defa...%20%281%29.jpg
... as the labor force participation rate rose above 63% for the first time since March 2014.
https://www.zerohedge.com/sites/defa...force%2063.jpg
Commenting on the rise in ht unemp rate, Bloomberg economist Yelena Shulyatyeva said that "the increase in the unemployment rate was entirely driven by rising participation, testament to the strong economy and robust labor-market attracting people from the sidelines."
Some more details from the report:
- Payroll employment rose by 2.6 million in 2018, compared with a gain of 2.2 million in 2017.
- Employment in health care rose by 50,000 in December. Within the industry, job gains occurred in ambulatory health care services (+38,000) and hospitals (+7,000). Health care added 346,000 jobs in 2018, more than the gain of 284,000 jobs in 2017.
- In December, employment in food services and drinking places increased by 41,000. Over the year, the industry added 235,000 jobs, similar to the increase in 2017 (+261,000).
- Construction employment rose by 38,000 in December, with job gains in heavy and civil engineering construction (+16,000) and nonresidential specialty trade construction (+16,000). The construction industry added 280,000 jobs in 2018, compared with an increase of 250,000 in 2017.
- Manufacturing added 32,000 jobs in December. Most of the gain occurred in the durable goods component (+19,000), with job growth in fabricated metal products (+7,000) and in computer and electronic products (+4,000). Employment in the nondurable goods component also increased over the month (+13,000). Manufacturing employment increased by 284,000 over the year, with about three-fourths of the gain in durable goods industries. Manufacturing had added 207,000 jobs in 2017.
- In December, employment in retail trade rose by 24,000. Job growth occurred in general merchandise stores (+15,000) and automobile dealers (+6,000). These gains were partially offset by a job loss in sporting goods, hobby, book, and music stores (-9,000). Retail trade employment increased by 92,000 in 2018, after little net change in 2017 (-29,000).
- Over the month, employment in professional and business services continued to trend up (+43,000). The industry added 583,000 jobs in 2018, outpacing the 458,000 jobs added in 2017.
So what does the Fed do now: pressured on both sides, on one hand by the sliding market which demands rate cuts, and on the other by the overheating labor market where wages appear to be on the verge of breaking out.
To be sure, as BBG's Steve Matthews notes, it's not a clear cut picture:
For the Fed, it was extremely unlikely there could be any possible move until March given its commitment to gradual rate hikes. So while today’s jobs report will be closely monitored by the central bank, the actual impact on policy seems pretty low. That’s because we’ll have gotten January and February employment updates by then, plus revisions to December.
By then, the Fed should know whether the most disturbing recent signals -- such as the ISM report -- are being reflected in the labor market, and the FOMC will know whether markets have continued to slide or have recovered some.
Hopefully we get the answer from Jay Powell in just a few hours when he speaks later this morning.
- #5,165
- Jan 4, 2019 7:58am Jan 4, 2019 7:58am
- | Commercial User | Joined Dec 2014 | 14,163 Posts
https://nftrh.com/2019/01/04/employment-blowout/
How typical. Just as everyone was getting beared up out comes the employment report featuring a blowout number of +312,000 in December (vs. an expected 188,000). Here is the blurb from BLS…
https://i0.wp.com/nftrh.com/wp-conte...16%2C314&ssl=1
This is not going to help the Jerome Powell bashers one little bit. Of course, with Apple tanking and the trade war raging on there are crosscurrents in play. But it looks like the bulls can get a little bounce in their step after all. The world had not yet ended as of December 31st.
Here’s the graphical breakdown of the jobs report.
https://i1.wp.com/nftrh.com/wp-conte...82%2C723&ssl=1
Also check out the quality market writers at Biiwii.com.
SNIPPET:
Ride ’em Cowboy
By Michael Ashton
One disease that afflicts writers of financial commentary…actually, probably commentators in all fields come to think of it…is that when the landscape gets in a ‘rut’ so does our writing. Eventually, if nothing changes about the economy or the market landscape, there isn’t much left to say and thus we (and I really mean “I”) are left repeating ourselves. For those of us who – despite all efforts – aren’t paid for our work, it means that sometimes the right thing to do is to just shut up.
And so that’s what I have done over the last year. As the equity market melted up in somnambulant sameness, as the economy chugged along without major crises or roadblocks…or, anyway, no change in those roadblocks…I wrote less and less. To be sure, part of that was because business was picking up, and this remains an impediment to me writing as frequently as I used to, but much of the reason I didn’t write so much was that not much was changing. There just aren’t many ways you can keep saying “stocks are too expensive, commodities are too cheap, interest rates aren’t at neutral levels, the Fed is screwing up, inflation markets are too low and inflation is rising,” so I took the time to work on other important things.
Continue reading Ride ’em Cowboy
Well, things are changing. Finally.
The stock market is going down for sensible reasons – which is a major change from when stocks were going up, for nonsensical reasons. President Trump’s trade war, which he promised would hurt China more than the US while every mainstream economist said the opposite, is in fact hurting China more than the US. But the frostiness of global trade relations is hurting growth globally, and pushing inflation higher just as we always knew it would. Domestic growth is slowing; although I’ve said for a while I thought there was a good chance that the US would be in recession sometime in 2019 – which suggestion was scoffed at roundly and regularly – it is starting to look like the US might actually be in recession sometime in 2019. In these events, there is something worth writing about!
Guiding a canoe across a placid lake is boring (although lots of equity analysts make a ton of money telling you to buy stocks when they’re going up – good for them!), but guiding a boat through rapids is fun stuff. So, let’s go ride those rapids. I won’t write every day, and I might not even write every week. I’m not sure how often I’ll do my live CPI breakdown…when I asked people to pay for that analysis, the resounding answer was that it wasn’t worth a ton, so I’ll do it when I feel it!
But that brings up another important point I want to be sure to mention: I am very grateful for those of you who did support my various experiments trying to establish the monetary value of my commentary. Some of you subscribed to my private Twitter feed, or the chart package, or bought my book. I really appreciate your voting with your dollars (or yen, or euros, or rupiah, etc) on my behalf. Moreover, I really value the feedback from readers of all persuasions – agreeing, disagreeing, or just expanding on the topic. Most of all, I appreciate those of you who have visited Enduring Investments or Enduring Intellectual Properties and have become clients. You know who you are!
We live, as they say, in interesting times. They’re about to get even moreinteresting, I’m sorry to say. But it gives me reason to write. Stay tuned.
Support 100% ad-free Biiwii.com by making a donation of your choice!
Or better yet, subscribe to NFTRH Premium for an in-depth weekly market report, interim updates and NFTRH+ chart and trade ideas to get even more bang for your buck. You can also keep up to date with plenty of actionable public content at NFTRH.com by using the email form on the right sidebar. Or follow via Twitter @BiiwiiNFTRH, StockTwits or RSS. Also check out the quality market writers at Biiwii.com.
- #5,166
- Jan 4, 2019 8:07am Jan 4, 2019 8:07am
- | Commercial User | Joined Dec 2014 | 14,163 Posts
https://www.zerohedge.com/news/2019-...ops+to+zero%29
"Yuuge" Jobs Sends Stocks, Dollar Higher As Rate Cut Odds Slide
https://www.zerohedge.com/sites/defa...?itok=LY4e264-
by Tyler Durden
Fri, 01/04/2019 - 08:57
US equity futures were initially disappointed by the great jobs print, but algos quickly BTFD to ensure good news is good news again.
https://www.zerohedge.com/sites/defa...04_5-52-22.jpg
However, the market's dovish positioning was unwound with a lower expectation of a rate cut now priced in...
https://www.zerohedge.com/sites/defa...04_5-48-50.jpg
Which sparked a bid in the dollar...
https://www.zerohedge.com/sites/defa...04_5-55-19.jpg
And pushed Treasury yield back above the Fed Funds rate..
https://www.zerohedge.com/sites/defa...2019-01-04.png
Interest-rate markets are reacting to strong U.S. jobs number with caution, said George Goncalves, head of Americas fixed income strategy at Nomura Securities.
Market is looking to Fed Chairman Jerome Powell’s appearance later Friday for further guidance
“So markets will not sell-off fully until he speaks - but if he is balanced/less dovish - this sell- off should continue.”
https://www.zerohedge.com/sites/defa...04_6-03-06.jpg
Bloomberg economist Tim Mahedy said:
The big question is - will Powell be able to talk the "good news" hawkishness back down?
Comments from Benjaminis: As always the strategy is all about MONEY FLOW.
The markets were caught by surprise by the number of 312,000 especially in light of the substantial drop in the stock markets during December 2018.
So now WE all are on hold until We (THE MARKETS) "We the People" hear what the CRIMINAL and unethical unelected FED Chairman has to say. That is why the market as of now has stayed relatively quiet although GOLD has been hit to go down.
GOLD is the enemy of the FED and is the "Canary In The Coal Mine"
I will wait until 9:30 AM to see where the markets actually go as the MONEY FLOW in the North Equity Markets start to FLOW !!!
Benjaminis
"Yuuge" Jobs Sends Stocks, Dollar Higher As Rate Cut Odds Slide
https://www.zerohedge.com/sites/defa...?itok=LY4e264-
by Tyler Durden
Fri, 01/04/2019 - 08:57
US equity futures were initially disappointed by the great jobs print, but algos quickly BTFD to ensure good news is good news again.
https://www.zerohedge.com/sites/defa...04_5-52-22.jpg
However, the market's dovish positioning was unwound with a lower expectation of a rate cut now priced in...
https://www.zerohedge.com/sites/defa...04_5-48-50.jpg
Which sparked a bid in the dollar...
https://www.zerohedge.com/sites/defa...04_5-55-19.jpg
And pushed Treasury yield back above the Fed Funds rate..
https://www.zerohedge.com/sites/defa...2019-01-04.png
Interest-rate markets are reacting to strong U.S. jobs number with caution, said George Goncalves, head of Americas fixed income strategy at Nomura Securities.
Bonds “will keep an eye on stocks and although this number is very strong -- and against all of the recent negativity -- the skeptics will discount this as potentially being backward looking,” he said.
Market is looking to Fed Chairman Jerome Powell’s appearance later Friday for further guidance
“This definitely sets the stage for Powell not coming out too dovish,” Goncalves noted by email.
“So markets will not sell-off fully until he speaks - but if he is balanced/less dovish - this sell- off should continue.”
https://www.zerohedge.com/sites/defa...04_6-03-06.jpg
Bloomberg economist Tim Mahedy said:
"This is the strongest employment report of this economic cycle -- hands down."
The big question is - will Powell be able to talk the "good news" hawkishness back down?
Comments from Benjaminis: As always the strategy is all about MONEY FLOW.
The markets were caught by surprise by the number of 312,000 especially in light of the substantial drop in the stock markets during December 2018.
So now WE all are on hold until We (THE MARKETS) "We the People" hear what the CRIMINAL and unethical unelected FED Chairman has to say. That is why the market as of now has stayed relatively quiet although GOLD has been hit to go down.
GOLD is the enemy of the FED and is the "Canary In The Coal Mine"
I will wait until 9:30 AM to see where the markets actually go as the MONEY FLOW in the North Equity Markets start to FLOW !!!
Benjaminis
- #5,167
- Jan 4, 2019 8:18am Jan 4, 2019 8:18am
- | Commercial User | Joined Dec 2014 | 14,163 Posts
http://traderfeed.blogspot.com/2019/...esnt-work.html
FRIDAY, JANUARY 04, 2019
Why Trading With Confidence Doesn't Work
https://3.bp.blogspot.com/-T9oICBcGD.../s320/Bias.jpg
One of the interesting dynamics I've observed during this recent period of market volatility is that many traders see large moves and thus want to make *the* big trade. They develop a market view and they trade that view doggedly, often ignoring actual price behavior.
What makes this worse is that it masquerades as "confidence" and "conviction". In reality, it is ego. It is us saying we know what the market we do and then digging in and looking for opportunities to express our view, so that we can be right. The need to be right can blind us to evidence that goes against our ideas--and it can especially blind us to opportunities on the other side of the trade.
We indeed see what we're prepared to see, which is why we should prepare ourselves for a multiplicity of scenarios. Once we decide we *know* which scenario will unfold, we're no longer prepared to see what could unfold. And that leads to losses and poor trading decisions. Feeling strongly about a view is as much a risk factor as a trading virtue.
Further Reading:
How Overconfidence Derails Our Trading
TraderFeed Home Page and Index
- #5,168
- Jan 4, 2019 8:20am Jan 4, 2019 8:20am
- | Commercial User | Joined Dec 2014 | 14,163 Posts
https://www.zerohedge.com/news/2019-...ops+to+zero%29
Authored by Elena Moya via BondVigilantes.com,
The new year has started with a blunt reminder of probably everything that investors wanted to forget over the holiday season: economic data is worsening while the oil price continues to fall, dragging down equities and the most equity-like fixed income asset classes. Traditional safe-havens continue to rally, as they did in 2018.
The year left behind ended far worse than it started: after a strong-growth 2017, where most fixed income sectors delivered positive returns, last year’s early hopes quickly sank with the escalation of the US-China trade war and the Italian elections in May, which raised questions about the future of the European Union (EU). Fears of a hard Brexit also weighed on the continent’s economic prospects, lifting credit spreads above those in the US for the first time in years.
China continued its slowdown, while in the US, optimism started to fade as interest rates rose, economic data disappointed and oil plunged to less than $50 per barrel amid forecasts of weak demand. US corporate earnings projections were also reduced as the effects of the recent tax cuts started to decline. The world benchmark US 10-year Treasury yield, which reached a 7-year high of 3.2% last year, changed gear after the Democrats won control of the House of Representatives in the November mid-term elections. Investors believed that their victory reduces the chances of further tax incentives from President Trump.
The 10-yr Treasury yield has been on a continuous slide since, ending 2018 at 2.66%.
Despite the pessimism, almost one third of the 100 fixed income asset classes tracked by Panoramic Weekly delivered positive returns last year, led by traditional safe-havens, such as German bunds and US Treasuries. With global growth slowing down and global debt reaching a whopping 225% of world GDP, investors are betting some central banks may have to rein in their rate hike projections – offering more support to bond prices. US Federal Reserve Chairman Jerome Powell already did in December – the Fed now sees 2 rate hikes this year, instead of 3. The M&G Panoramic Weekly team wishes you a very happy new year.
Heading up:
Safe-havens – the best of times in the worst of times: US Treasuries, European government bonds and Japan’s sovereign debt did in 2018 what they usually do: deliver positive returns, rain or shine. While corporate debt markets and developing nations suffered from higher interest rates, a stronger dollar, the ongoing trade wars and lower global economic growth, traditional safe-havens remained solid. Treasuries have only posted negative returns in 2 of the past 18 years (2009 and 2013), while European and Japanese government bonds have only missed 1 year of positive returns (2006 and 2003, respectively), over the same period. Sovereign bonds have been favoured by protracted global low inflation, a backdrop that may continue going forward given the recent plunge in oil prices.
Weaker growth and rising global debt may also refrain central banks from tighter monetary policies: out of 19 major economic areas, 5 are projecting lower rates in 3 years’ time (the US, Mexico, the Czech Republic, Japan and Korea), compared to none barely 2 months ago, according to Bloomberg data. In terms of currencies, safe-havens have also outperformed, mainly the US dollar and the yen. As Dickens would have put it, for safe-havens, it was (is?) the best of times, it was (is) the worst of times; it was the age of wisdom, it was the age of foolishness...
https://www.zerohedge.com/sites/defa...-03-charts.png
China government bonds and loose policy – odd one out: China’s USD-denominated sovereign debt returned 3.8% to investors in 2018, the third best performer among the 100 fixed income asset classes tracked by Panoramic Weekly. The rise comes despite a slowdown in economic growth, now down to an annualised pace of 6.5%, from 6.9% last year. The country’s manufacturing PMI dropped to 49.4 in December, the weakest since 2016 and below the 50 level that marks a contraction. Yet, the Chinese government’s stimulus policies, including cuts in the banks’ reserve requirements, continue to support the economy and the bond market. Still mostly in the hands of local investors, Chinese debt is increasingly available to foreign holders via the Bond Connect programme, and may be more in demand after it is included in some Bloomberg Barclays benchmark indices from April this year. In the present global rate rising environment, investors welcome a country with an overall easing policy.
Heading down:
Business cycle – down-sloping? With the last recession now a decade ago and economic theory suggesting that cycles tend to last about 10 years, investors are understandably concerned – hence their preference for safe-havens over risk assets. But more than timing, the nervousness comes amid other signals: during the late expansion phase of a business cycle, economic growth tends to be above the long-term trend growth, but the pace starts to slow down. In the US, for instance, growth is expected to drop to 2.6% this year, and to 1.9% in 2020, down from an expected 2.9% in 2018. This “late expansion” phase is also characterised by restrictive policies (which we are seeing around the world as central banks move from Quantitative Easing to Quantitative Tightening), and by rising inflation (in the US, inflation is expected to rise to 2.4% in 2018, up from 2.1% in 2017). Interest rates are usually higher (the 2-year Treasury yield, the de facto world’s discount rate, leapt from 1.8% to 2.49% in 2018), bringing volatility to equity prices (the S&P 500 index lost 6.2% last year).
If this “late expansion” narrative applied well in 2018, the new year might bring us the following “slowdown” phase, where we usually see: slower growth (already forecasted), peaking consumer confidence (this is a lagging indicator as consumers typically need to see weak data before holding up purchases), a cooling off of restrictive policies (Fed chair Powell could have already signalled this in his dovish December speak), as well as higher inflation (also in the cards in the US). In this environment, long term bond yields usually drop as investors discount the slowdown, while equities suffer from the anticipation of a future recession, which would be the next stop. As usual, opinions vary: while the Fed sees 2 rate hikes next year, and further tightening in 2020, markets are pricing in no hikes at all this year, and cuts afterwards. Nobody knows what the future holds, but over the past few years, markets have been better predictors than then Fed.
https://www.zerohedge.com/sites/defa...-03-charts.png
EMs – tough year: Emerging Markets (EMs) USD-denominated sovereign debt fell 4.3% last year, the third annual loss over the past 18 years (the others being in 2013 and 2008). The period also includes ten years of double-digit positive returns, as the asset class benefited from strong global growth in the early 2000s, while remained relatively immune to the 2007-2008 financial crisis given its lower banking problems. But 2018 brought them a toxic mix of a rising dollar, falling oil prices (which hit oil-exporting EM heavyweights such as Brazil, Mexico and Russia), trade wars and idiosyncratic problems in Argentina and Turkey. All this hit African, Middle Eastern and Latin American countries the hardest, with Eastern Europe and Asia remaining more resilient. Some investors argue that the fate of EMs may change this year as the ‘twin deficits’ in the US may contain any dollar surge while global growth is forecast to stay positive, albeit unspectacular. Some also believe that with yields at 6.8%, the highest since 2009, risk might be compensated.
Benjaminis
- #5,169
- Edited 9:28am Jan 4, 2019 8:28am | Edited 9:28am
- | Commercial User | Joined Dec 2014 | 14,163 Posts
http://icecapassetmanagement.com/
http://icecapassetmanagement.com/glo...es-hugh-grant/
December 2018 IceCap Global Outlook – “Where’s Hugh Grant?”
The European Union (EU) is a political and economic union of 28 member countries.
Its stated goals are to promote peace, freedom, and justice. It will also enhance economic, social and territorial cohesion, while also respecting everyone’s rich culture and diversity.
Reality is a different story.
The EU is a bully.
Its short history is littered with continuous, venomous, and contradicting actions against many of its 28 member countries – and all to the benefit of those in Brussels.
It has been documented, that bullies only respond to strength. And today across the EU – the victims of the bullies in Brussels are fighting back.
The political establishments are quickly losing power.
The tide has turned, and it will have a profound effect on the EU, the Eurozone and global financial markets.
Every major shift in economics, politics and social environments creates significant investment opportunities.
This time will be no different.
Read PDF here 2018.12 IceCap Global Market Outlook
Actually, Love is all around
Reality, is a different story. Britain is once again being bullied and this time by the European Union (EU). Sadly, neither Nelson, Churchill, Thatcher or even Hugh Grant for that matter are around to stand up for everything that once before put Great in front of Britain. In some ways, Britain shouldn’t feel too badly about lacking a backbone – after all, since the creation of the EU, Brussels has been bullying everyone who dared to stand in its path towards its dream of an administrative, centrally planned utopia.
In 2008, the Irish voted AGAINST the Lisbon Treaty dealing a major set-back to Brussels and its goal of gradually centralizing control of Europe. The EU responded by calling the vote a “triumph of ignorance” and demanded the Irish vote again, and again until they got the vote right. The Irish relented, and voted again to make things right. In 2012, Italy faced a moment of truth. Its government was completely shut-out of funding markets. No one would lend them a penny. And with the 3rd largest debt load in the world – Italy desperately needed to borrow money, just to repay previous loans that were coming due. The room was deflated. There was no confidence, zero self-esteem, and even the famous stiff upper lip was missing. Once again, the British were bowing to yet another sovereign state. Nelson would have been furious. Churchill would have snowballed into a spitting rage. Thatcher would have coiled to launch a counter attack. Those were the days. Today, surveying the room, the Prime Minister understood what was at stake. Something had to change. It was time to stand up to the bully. He would do it for his girlfriend. He would do it for his sister. He would do it for his country. Slowly, there was a deep breath, a pause, and then it happened.
Channelling the spirits of Shakespeare, Churchill, The Beatles, Connery, Potter and both of David Beckham’s feet provided Hugh Grant with the courage to stare down the bully and respond with the one thing that works against a bully – strength. The fictional British PM from the lovely British film, “Love Actually” would go on to lift the self-esteem & self-confidence for all of Britain
After weeks, and then days and then late night hours, then Prime Minister, Silvio Berlusconi made the decision that he would pull Italy out of the Eurozone, and devalue a new Italian Lira. It was the only solution. Instead – the bullies in Brussels once again took action and before most Italians tasted their morning macchiato, Berlusconi was bullied right out of office and replaced with a Brussels appointed technocrat. Imagine an unelected entity removing a country’s elected head of state. Unthinkable – unless of course, your country is a part of the EU. The list of EU bullying goes on and on and on. Portugal – bullied. Spain – bullied. Greece – bullied. Cyprus – bullied. But, as everything moves in cycles – the days of Brussels, France and Germany dictating to the rest of the EU are over.
Push-back against the status quo and the political establishment is not only gathering steam – but it is spreading across the EU. In Spain, Catalonia stood up to the Brussels-controlled Madrid and did the unthinkable – they wanted a peaceful vote on whether Catalans wanted to be an independent country. Ironically, just as the Irish were encouraged to vote – Brussels and Madrid did everything in their power to discourage Catalonia from voting. That’s what a bully does – it changes the rules and playing field to always suit itself. This time however, Brussels' bloody crackdown on a peaceful public vote horrified the internets around the world. In the end, the bully stopped the “outcome” of the vote, but it left the fight battered in the polls of global public opinion. Others took notice. In Hungary, no one wanted any part of the EU migrant policies dictated by Brussels. Prime Minister Viktor Orban declared Angela Merkel unilaterally created the crisis, and his country would have nothing to do with Germany’s problem.
Poland, Slovakia and the Czech Republic also agreed with Orban, and united they stood tall, erected walls and told the bullies in Brussels where to go. This time, the bullies in Brussels relented and gave in to the Eastern European countries. The Italians were next to keep the momentum going. Their newly elected coalition is giving Brussels the fits. Brussels demanded an EU approved budget. Italy told them it was their money and they’ll spend it and tax it as they wish. Brussels then told Italy to accept more migrants. Italy said no, closed their waters and borders and sent all migrant boats to Spain and France. And no matter how hard the Brussels bullies push back – the Italians, push back even harder. With Brussels reeling and dealing with these new headaches – it clearly wasn’t prepared for what would happen next.
Enter Germany – the original home of the Euro and the real home of the EU central command . Angela Merkel has always been seen as the de facto leader of the EU. What Merkel wanted – Merkel got. And she got 13 years of ruling the EU – outlasting leaders from France (especially France), Italy, Spain, Britain and others. Yet, as everything (especially politics) runs in cycles – Merkel too is showing she is not immune to the volatile swings and movements engulfing the world. While many are now familiar with unhappy voters rising to the polls across “other” European countries – most are completely unaware that the same is happening in Germany. Recent German elections produced the unthinkable – a clear and present danger to the celebrated political career of Merkel. First her coalition party was clearly defeated in a regional election. And then Merkel too, faced her own day of reckoning as her own party voted her down on key recommendations.
Realizing her German political future is over – she bravely announced she would not be running for any re-elections. And just like that - there she was, gone. With Merkel’s power diminished, Brussels will now have to rely upon French President Macron as the new bully in town. Seems like a great idea – except, just as Merkel lost support, so too is Macron. The celebrated nouveau leader of Europe’s rise to the top has now come crashing down harder than an ill prepared soufflé. With current approval ratings running lower than that of previous French President Hollande (and THAT is saying something), Macron knew he needed something to right the ship. Instead, his political ship was just capsized, rolled, and swamped – all at the same time. As most are aware by now, France was rocked by national protests against Macron’s new fuel taxes.
What started out as a protest in rural France, quickly dissolved into thousands rioting and looting up and down the Champs-Élysées. Ordinarily, the head of state would declare a national emergency, release the military and put an end to this moral inconvenience. However, in Macron’s case – just as Merkel became a sheep for slaughter,so too would Macron. In other words, Macron did not have the political capital (or will) to follow through with his climate-saving, fuel tax increase. Instead, Macron caved. The tax has now been delayed indefinitely, and to compensate for the lost tax revenues – something else will have to be taxed in its place.
Evidential Proof wealth tax will be enough to scare the merde out of everyone. As you can imagine – every “wealthy” family in France is reading this news today and they’ve already started packing their bags. Of even greater significance, this recent crisis for France has far reaching effects outside of the French business community. The days of Brussels bullying other EU member states is OVER.
Which also means, the status quo of the EU and Eurozone is absolutely going to change. If the EU holds together, power will be decentralized. The financial outcome must therefore also change.
The IceCap view on the Eurozone is crystal clear, 100% consistent, and further confirmed by the recent events in Germany and France. The bully has been bullied, and times have now changed. Be prepared. And with France ranking highly amongst the most socialist-leaning countries in the world, the target of the new replacement tax is easy - the rich. Which of course, will absolutely lead to yet another round of unintended (yet, easy to predict) consequences. It is already well known that France is not a tax-friendly country for neither corporations nor high income earners. Just a few years ago, then President, Francois Hollande’s tax budget imposed a 75% tax on anyone earning more than EUR 1 million. Somehow, the negative reaction from the business community was completely unexpected by the French government and it forced them to abandon the tax plan. At the time, IceCap wrote that the inconsistency on tax policies would force companies and individuals to re-think setting up shop in France. Well, if somehow the Hollande 75% tax scare wasn’t enough to frighten away the international business community – the new Macron wealth tax will be enough to scare the merde out of everyone. As you can imagine – every “wealthy” family in France is reading this news today and they’ve already started packing their bags. Of even greater significance, this recent crisis for France has far reaching effects outside of the French business community.
The days of Brussels bullying other EU member states is OVER. Which also means, the status quo of the EU and Eurozone is absolutely going to change. If the EU holds together, power will be decentralized. The financial outcome must therefore also change. The IceCap view on the Eurozone is crystal clear, 100% consistent, and further confirmed by the recent events in Germany and France. The bully has been bullied, and times have now changed.
Stock Markets The selling frenzy that began in October continues. Recall, IceCap is asset class agnostic – we neither love nor hate any investment market.
Instead, we believe (and know) there are times to be invested in specific markets, and there are times not to be invested in specific markets. Also recall, in our October 2018 IceCap Global Outlook we announced that we sold equity positions by nearly 1/3. In other words, IceCap reduced client exposure to equity markets by a significant amount.
Unlike the majority of investment managers – and especially unlike every big box bank, IceCap did not sit on our hands, fingers and thumbs and “talk” our way through difficult client meetings. Instead, we walked the walk. It is true, we were not able to completely protect client capital. Yet, we have been able to soften the jarring blows. And when we say jarring – we mean jarring 2018 Year to Date performance by the broadest markets continues to show only 1 market with its head above water – the USA. While US equities hover just above the magically 0% number, other national stock markets would give a year’s supply of QE (Quantitative Easing) to be even close to that number.
Elsewhere, broad market returns range from -4% to -10% and lower. Yet, this is where the devil is in the details. Few investors invest in the boring, broad markets. Instead, the big mutual fund firms, the even bigger insurance companies, and the gigantic big box banks all sell their clients on the investment adventure of a lifetime – the “search for yield”. Now, the reason the majority of the investing public are searching for yield, is entirely due to global central banks reducing overnight interest rates to 0%, and negative %, and then printing money (QE) to help reduce longer-term interest rates. Effectively, these central banks lowered interest rates everywhere. Academics said this would stimulate the economy. Realists said this would force savers to invest in other higher yielding investments which would expose many of them, for the first time in their investments lives – to unusual risk.
Many “search for yield” investors, piled head first into emerging market bonds. In 2018, these bond markets are down -10%. How’s that for a safe investment. Other “search for yield” investors, jumped into high yield bonds. In 2018, these bond markets are down -5%. How’s that for another so-called safe investment.
It gets worse. Other “search for yield” investors believed in the buy stocks for dividends story. In Canada, these energy dividend paying stocks are down -20%. And in Europe, these bank dividend paying stocks are down -25%. And if the “search for yield” in obscure bond markets and odd dividend paying stocks wasn’t your thing – then the appeal of preferred shares was definitely appealing. Except, the mathematical laws of investing proved yet again there is no manufactured risk-free lunch in the investment world, and especially in the preferred share world.
In 2018, these preferred share strategies are down -10% in the United States and -16% in Canada. Using this as perspective, broad market returns of -5% and worse, are not as bad as the returns experienced by those in the safe “search for yield” adventure.
Currently for IceCap portfolios, our equity models are stabilizing. This suggests the price action of the current stock market correction are neither deteriorating further, BUT nor are they improving significantly. For now, we are retaining our equity and cash positions and will continue to objectively assess whether our next equity market move will be to either decrease or increase our allocations. Of course, EVERY market is connected one way or another. And, despite everyone talking about stock markets.
Without hope or agenda December 2018 Where’s Hugh Grant? Asymmetrical Risk-Return Relationships Want to know why the house always wins in Vegas? It’s because the odds, or probable outcomes are always in favour of the house, or put another way – the gambler always has the deck stacked against him. This concept is called the asymmetrical risk-return relationship, and it also exists in the investment world.
The average investor is told that stocks always go up over the long-run. Although the long-run is rarely defined, and it’s never the same for every person or every market; this expression is effectively trying to describe an asymmetrical risk return relationship. This relationship is one where the expected positive returns from the stock market significantly exceed the expected negative returns from the stock market. The same is also true for the bond market. When bonds are paying you interest payments of 3% a year – you expect to receive at least 3% as your return, and never anything less than that – after all, it’s a BOND and bonds are safe.
And THIS is the key concept that the majority are missing, fail to understand, or are simply not allowed to discuss. What we mean by this is that in the bond world, virtually every investor has been told that bonds are always safe, you’ll always get your money back, and they are meant for conservative investors, and investors who want to keep a little somethin’-somethin’ for a rainy day. Of course – IceCap is telling you, this is wishful thinking. 2018 is not the same as 2008, 1999, 1989 or even 1982 for that matter.
The financial world we live in today is COMPLETELY different than any other moment in time ever experienced by anyone in the investment world. For two reasons. First over the last 38 years, long-term interest rates have steadily declined from nearly 20% all the way to 0%. This is important, because as long-term interest rates decline steadily – bond market returns increase steadily. This trend has reversed, and so too will the investment experience for everyone investing in the global bond market. Second, the debt super cycle borrowing binge was all enabled by unchallenged, free wheeling governments fueled by low interest rates on borrowed money.
The Creation of Asymmetrical Risk-Return Opportunities Across Bond Markets December 2018 Where’s Hugh Grant?
Reason #1 36 Yrs of interest rates declining from 20% to 0%
Reason #2 36 Yrs of borrowing fueled by interest rates declining from 20% to 0% What happens when long-term interest rates rise rapidly? • Bond prices decline rapidly • Borrowers ability to borrow decreases rapidly • Stress across funding markets escalates rapidly • Decline in bond prices will be multiples of the interest payments received from your bonds
www.IceCapAssetManagement.com
But the truth is, I’m in love December 2018 Where’s Hugh Grant?
Yet these two, very easy to see and very easy to understand facts are completely missing from the investment industry, the investment media and most disappointing of all – the universities and colleges who are churning out CFA seeking millennials by the boat load.
Recently, we’ve had several conversations with larger pension funds who all recounted how increasingly their bond fund managers have turned into 30 year olds. While, there’s nothing wrong with a little youth movement every now and then – there is something wrong when these young guns are charging through fixed income presentations extorting their 10 years industry experience and pounding the table on the incredible opportunities they expect to occur in the land of bonds. To be clear – there’s now an entire generation of investment professionals around the world who’s entire career (both professional and academic) has occurred during a period dominated by: - 0% interest rates - negative% interest rates - QE and money printing - bank bailouts - and sovereign debt bailouts
Why is this important?
This is important because the industry as a group creates, forms and distributes risk-return expectations for every dollar in the investment universe. When markets are charging dead ahead into an all-certain event, the investing public looks for leaders. It looks for dynamic wisdom. It looks for 5-dimensional thinking. Instead, the industry is increasingly being lead by fearless leaders who’ve earned exactly zero stripes, no investment scars, and who are not compensated to see the investment world for what it is – a complex, interconnected relationship between and amongst multiple factors which always move in sync (positive and negative correlations) during significant turning points.
While everyone today is closely watching equity markets – and justifiably so from a daily movement perspective, the majority do not realize the market magician is using the oldest trick in the book – distraction with the slight of hand. In the world of magic – there really isn’t any magic. Instead, the slight of hand, moves just enough to distract the audience from what is really happening. And yes, corrections in equity markets are very unsettling.
Yet, unlike the majority, we have not taken our eye off the ball, nor have we become distracted by the emotional market churning noise. And we most certainly, have not been lulled into a sleeping comfort by the new generation of bond managers. Instead, we share with you the market trick at hand – the asymmetrical risk-return relationship currently offered to every investor in the world. Our diagram on this page illustrates the return expectations for the bond market. The “A” column is representative of current global fixed income markets. The upside to investing in low-risk bond strategies is approximately 3%. Yet, as IceCap’s expectation for a crisis in sovereign debt escalates, the expected losses will be 20% or more. We tell you with certainty – these are the kind of odds you normally would only find in Vegas. In bond markets today, the sellers of bonds are pulling the wool over the eyes of the buyers of bonds.
And we’re sorry to tell you, everyone today including mutual fund investors, target date funds, life cycle funds, and especially pension funds are set-up for long-term losses in their fixed income strategies. We’ll next show you why this fixed income market environment cannot be avoided. It will happen. That’s the bad news. The good news is, it doesn’t have to happen to you.
IceCap is developing a strategy that will turn the tables on this asymmetrical risk-return relationship. In other words, investors can benefit from this asymmetrical riskreturn relationship in the bond market. In simple terms, IceCap through a partnership with another Firm (USbased) is creating a strategy that will allow investors to shift from the “A” column to the “B” column. We are receiving interest from investors from all over the world including individuals, pension funds, banks and family offices. If you’d like to hear more – please contact: Keith Dicker [email protected]
Actually, news is all around Yes, equity markets continue to soak up every minute on headline news medias. Yet, the global bond market continues its relentless march toward a certain, spectacular event. First up with a warning, comes from none other than the Warren Buffett owned Moody’s: Granted, Moody’s is the same Moody’s who failed to warn anyone about the 2008-09 credit crisis.
Back then, Moody’s was competing furiously with Standard & Poors to earn as much in ratings fees as possible. In other words, their hands were so deep into the cookie jar – they were completely blinded by the monetary sugar-high. Clearly knowing they are now in the cross-fire of the regulators, Moody’s is on point with their warning of potential defaults in one of the “searching for yield’s” favourite market - the High Yield Bond sector. Which of course is also known as the Junk Bond sector. Years from now, when High Yield investors are still asking how the industry misplaced their shirts, regulators will undoubtedly show its teeth and ask the industry why it subtly changed the name of these funds from “Junk” to “High Yield’.
The answer of course is because who in their right mind would invest their hard earned savings in something called “junk”? High Yield definitely sounds better, much better. But let’s be honest here, there’s no way you’ll hear that from the industry. Meanwhile, other announcements from the bond world should also be catching your eye.
I Love that word “relationship” The response was as expected – “blah, blah” and then more “blahs” about the business model, management team and credit rating. Now, here we are years later and investors are realizing that debt, debt levels, and borrowing rates DO matter. As well – there never was a “best management team” etc. Yes, GE stock and GE bonds have been absolutely decimated by its inability to continue on with its financial “competitive advantages”.
Yet, the single, biggest lesson all investors (not just GE investors) need to acknowledge here is the rapid decline in the value of GE’s bonds. It seems even the self-proclaimed world’s safest banks cannot escape the oncoming stress in the sovereign debt world. And, let’s not forget the outright disaster engulfing the once shining, bluest of blue chips – General Electronic: A few years back, I remember attending a presentation by GE’s investor relations team. Back then, the story was – “GE is AAA rated, has the best management team on the street and the best business models money can buy.” After the presentation, I privately commented to the presenter – “I don’t get it. Seems to me, GE is a manufacturer of industrial and consumer goods who increases their low margins by providing aggressive vendor financing.
GE Bonds declined 25% over a 1-week period. (15)
Here’s an important message from your Uncle Bill Note the following: This chart shows the cumulative growth in money printing by the European Central Bank (ECB). We’ve shared before how in 2009 global central banks declared the only way to save the system was to print money. When we first heard this announcement – we thought maybe, central banks would actually send everyone cheques every week to encourage them to spend, which would help the economy eventually grow and upright the ship.
Naturally, common sense doesn’t exist in the academically dominated world of central banks. If any charts, diagrams or observations should rush a chill down your safe bond spine – this is it. Remember – GE wasn’t a high yield, or junk bond. It used to be a AAA rated issuer of debt. It was the real deal. Of course, the bond bulls will proclaim GE is a stand-alone story. It’s a star that lost its shine. Well, over the last year IceCap has shared with clients and readers numerous stand-alone fixed income stories that are developing into entire universes with illumination problems. One or two isolated events related to stress within bond markets are indeed stand-alone stories. But when we consistently see stress building across the global yield curve, amongst both sovereign/government debt and private sector debt – you should take notice. Taking Notice IceCap has identified numerous stress points across the global yield curve. Yet, the one pressure point that continues to flash red is the Eurozone.
The deep troubles across this common currency zone continue to grow deeper and wider. This chart shows the cumulative growth in money printing by the European Central Bank (ECB). We’ve shared before how in 2009 global central banks declared the only way to save the system was to print money. When we first heard this announcement – we thought maybe, central banks would actually send everyone cheques every week to encourage them to spend, which would help the economy eventually grow and upright the ship. Naturally, common sense doesn’t exist in the academically dominated world of central banks.
Clearly since the 2009 crisis escalated, the economy and money supply grew hand and hand. Yet, the chart also shows the growth in European bank lending.
And this is what catches our eye. As a result of IceCap’s well documented and less enthusiastic financial view towards the Eurozone - we often receive unsolicited ‘advice’ from other investors proclaiming the Old World to be in terrific shape, everything is fine and to see otherwise, simply means we do not understand what it is to be European. Now if being European means, one is unable to objectively conclude when the financial foundation of a currency sharing, non-debt consolidating, and non-fiscal consolidating currency union is rotting at the core – then yes we agree.
Of course, most investment professionals know that a healthy economy is one supported by healthy bank lending growth. Yet, one can see from this chart that despite the Eurozone economy growing since the 2009 crisis, bank loan growth actually been in decline. This isn’t good. In fact it’s not even close to being not good – it’s outright frightening.
Instead of printing money and giving this money to the average Joe, the central banks decided instead to print money and give it to governments. Put another way – instead of letting consumers, capitalism and the invisible hand solve the crisis, central banks decided that our governments would know better how to spend these printed monies.
Nearly 10 years later, the ECB continues to print money – and with very little effect.
It’s a self-preservation thing We can tell you with certainty, this is the clearest sign that European sovereign debt is in one, very big bubble. And this is trouble.
If that doesn’t catch your fancy, here’s another perspective of the same story: Effectively, the ECB is a self-preservation thing We can tell you with certainty, this is the clearest sign that European sovereign debt is in one, very big bubble. And this is trouble. If that doesn’t catch your fancy, here’s another perspective of the same story: Effectively, the ECB is the life support machine and the Eurozone has been plugged in and barely staying alive.
Every time the ECB prints money, it uses this money to buy bonds issued by the 19 countries who make-up the Eurozone monetary union. The chart on page 15 shows that as of last week, the ECB has printed money and purchased over EUR 3 TRILLION in government bonds. The reason this is important and how/why it ties into the IceCap discussion about asymmetrical risk-return opportunities is as follows: - the ECB buying government bonds has resulted in private investors being crowded out of the Eurozone sovereign bond market - 40% of European government bonds now yield NEGATIVE % Just to be clear, this chart (next column) should be front and center on every investment managers report, on every mutual fund report and certainly on every pension fund CEOs report. But it isn’t.
Instead, the fact that 40% of European sovereign debt pays NEGATIVE interest to its investors, or put another way – over EUR 3 TRILLION in European government bonds are priced with a NEGATIVE yield is completely lost upon most investors.
Beautiful Aurielia
Eurozone countries and governments cannot absorb higher interest costs. Higher rates becomes the end of the Euro story. But it just won’t be contained in Europe. Other plain, easy to see hurdles exist elsewhere. This chart below details the “maturity” wall facing borrowers in the high yield (junk) bond market, and any increase in interest rates will make life very difficult for these companies. And what makes this chart even more interesting, is that it’s prepared by an European bank (the largest one actually), and it actually uses the word “Bubble”. From a market perspective – the crisis here occurs as soon as the yields on all of these NEGATIVE yielding bonds begins to turn positive. We know this. The ECB knows this. And the market knows this. Meaning, effectively – it’s a waiting game.
The ECB and Mario Draghi know private investors have zero interest in buying European sovereign bonds (or any bond for that matter) with NEGATIVE yields.
Put another way – the ECB knows there is no market for this stuff. To make matters worse – the ECB also knows that the Euro sovereign states issuing these bonds (Italy, France etc) cannot operate their governments if interest rates rise higher. After all, each Eurozone country is running a deficit, plus they all have mountains of past debt coming due.
The only way this European economic fantasyland is holding together is due to the ECB manipulating interest rates to NEGATIVE levels.
I’m so excited. Slower and lower growth means less tax revenues. Less tax revenues means bigger deficits. Bigger deficits means more borrowing. Pretty bad stuff here. But the one ingredient that will really make this recipe toxic is rising interest rates. Higher rates will make it more expensive for governments to borrow – which causes deficits to deteriorate even further. In conclusion – the world is absolutely headed for an economic slowdown. However, it will be a slowdown unlike any other slowdown we’ve previously experienced.
Financially, this makes us excited. And we suspect, it may even cause Hugh Grant to sing and dance as well. The Last Word The chatter about an impending recession is true – we agree. Mind you, don’t get caught up in the media-definition of recession having to be NEGATIVE GDP growth over two consecutive quarters.
Global growth below 3% qualifies as a recession. China growing below 5% qualifies as a recession. The point is that, the global economy has been slowing now for a while, and if not for the American tax cuts – growth would have been grinding even slower. Traditionalists are quick to argue that slower growth and recessions are bad for stocks.
IceCap is telling you this isn’t always the case. There are periods of slowing growth when stocks are doing well and there are also periods when economic growth is doing very well and stocks are declining. The point we make is that the investment world is not 1-dimensional. The far bigger concern with the on coming recession/slower growth economy is the impact on government tax revenues.
Yep, solid gold Our Strategy Bonds No changes.
Our primary concern remains focused on the probability of long-term rates surging due to re-escalation of sovereign debt crises. Some of our best investment ideas are on the short side within different fixed income markets. See Page 12 for opportunities. Stocks Changes – in October we decreased equities significantly.
Remaining objective about whether to decrease further or increase significantly. Currencies We continue to remain structured to benefit from a strengthening USD. The combination of increased global demand for USD and tightening economic/social/political conditions is creating a high probability of foreign capital seeking safety, protection and liquidity in USD.
It could surge.
Commodities
We missed the rally in crude. Yet, we didn’t chase it at the top either.
A strengthening USD is not yet optimal for a bull market in gold. We have no positions in oil or gold at this time. Stay patient.
As always, we’d be pleased to speak with anyone about our investment views.
We also encourage our readers to share our global market outlook with those who they think may find it of interest.
Keith earned the Chartered Financial Analyst (CFA) designation in 1998 and is a member of the Chartered Financial Analysts Institute. He has been recognized by the CFA Institute, RealVision, MacroVoices, Reuters, Bloomberg, BNN and the Globe & Mail for his views on global macro investment strategies.
He is a frequent speaker on the challenges and opportunities facing investors today, and is available to present to groups of any size.
Our Team: Keith Dicker: [email protected]
John Corney: [email protected]
Haakon Pedersen: [email protected]
Andrew Feader: [email protected]
Conor Demone: [email protected]
Comments from Benjaminis: This is what Fundamental Analysis is all about. You need to understand the truth of what is really happening so that you are not caught by surprise.
I will have more to say after the discussions later today by the UNELECTED Federal Reserve created by the US Government and the President in the middle of the night on December 23, 1913.
- #5,170
- Jan 5, 2019 9:04am Jan 5, 2019 9:04am
- | Commercial User | Joined Dec 2014 | 14,163 Posts
https://www.kitco.com/commentaries/2...into-2019.html
Contributed Commentaries
Gold Continues to Climb a Wall of Worry into 2019
https://www.kitco.com/ind/DavidErfle...avid-Erfle.jpg
David Erfle Friday January 04, 2019 09:47
Kitco Commentaries | Opinions, Ideas and Markets Talk
Featuring views and opinions written by market professionals, not staff journalists.
Commentaries & Views
Share this article:
Gold prices hit their highest price in six-and-a-half months on Thursday, as volatile equity markets on the back of weak US data heightened fears of a global economic slowdown, propelling the safe-haven metal towards a potential third straight weekly gain. The equity sell-off is beginning to pose a systemic risk, which has investors worried as equity losses are exposing the fact that markets were far more fragile than they appeared heading into year-end.
Two years of rate hikes and erratic political leadership has investors expecting a sharp downturn in 2019. So much so that Fed futures are now showing that most participants are predicting zero rate hikes this year. This assumption gained more traction after the market closed its first trading session of the new year on Wednesday, when Apple Inc (AAPL) announced its first revenue guidance contraction in 12 years, along with weaker Chinese IPhone sales. The news from the technology giant sent investors fleeing into bullion and influenced the Australian gold price to trade at an all-time high on Wednesday evening, while Canadian dollar gold inched toward $1750 per ounce in yesterday’s session.
Meanwhile, gold futures denominated in U.S. dollars is backing off from strong resistance at the $1300 mark after the last U.S. Non-Farms Payroll (NFP) report of 2018 was released this morning. The report came in much better than expected, presenting a quandary for the Federal Reserve and Wall Street. While other reports suggesting the economy is slowing, a tight labor market and rising wages could also put upward pressure on inflation. The Fed has to keep inflation at bay without slowing the economy when it raises rates.
Another bullish development in the gold complex began to take place during the last few trading sessions of 2018. The gold/silver ratiobegan to move lower, meaning silver is beginning to lead gold higher. The rally in silver, coupled with the out-performance of the juniors since last week, has given further confirmation of the two month move higher in the gold price. Historically, it is best to see silver trend more or less in line with the gold price. Otherwise, if the two metals are diverging from one another, the odds are high that a gold rally will quickly reverse.
The recent weakness in the U.S. dollar index is another major reason behind silver’s latest rally as it appears to be rolling over, while remaining below its 50-day moving average. Continued weakness in the dollar will further ensure gains for both gold and silver, although a declining dollar index isn’t necessary if global markets remain in turmoil. The important issue is that the dollar index isn’t trending higher, for when it is, it severely erodes gold’s currency component.
What is also encouraging for gold bulls is silver has now begun to de-couple from sinking base metals while leading gold higher, as opposed to being previously sold down for its industrial qualities. In addition to this week’s Apple report on weaker Chinese iPhone sales, Chinese manufacturing activity during December fell below 50 for the first time in nearly two years, which means the world's second largest economy is contracting. The Chinese economic weakness, together with the ongoing U.S/China trade war and the global economic slowdown, has both copper and zinc charts creating ominous head & shoulders topping patterns on a weekly basis, while silver continues to rise with gold.
In my last missive of 2018, I mentioned junior gold stocks being the best deep value play for this year. Many of the quality companies have already seen strong moves as tax-loss selling is now mercifully behind us. Although the gold rally is becoming over-extended, I feel the impact of its inevitable correction on the juniors will be minimal, since most were sold down much more than the gold price during a particularly brutal Tax-Loss Selling Season last year.
I strongly believe the junior precious metal equity space has formed a significant long-term bottom, which will morph into the next leg higher in the complex by mid to late 2019. The TSX-V was hit for over 40% in 2018 before producing a big white candle during the last week of trade and is forming another this week.
The Canadian junior index was hit hardest as gold was forming a bottom over the past few months, making the risk/reward the most attractive I have seen in the junior resource space since December 2015.
While the GDX was working off a short-term overbought situation by trading just below strong resistance at $21 the past few weeks, it appears as though we may get a weekly close above this important price point today. The 200-day moving average in the global miner ETF lies just below this mark and is maintaining support, while beginning to flat-line. The rising 50-day moving would give us a bullish cross if GDX can make a run towards $25 soon. Even though both gold and silver have moved into technically overbought territory, sentiment indicators remain in neutral territory, meaning investors have not become overly bullish on precious metals yet.
After much laborious research and chart watching during Tax-Loss Selling Season, I spent the last few weeks of a frustrating year completing long-term positions in a basket of gold and silver juniors. If you require assistance in choosing the best quality juniors to invest, please stop by my website and check out the subscription service at http://juniorminerjunky.com/
By David Erfle
Contributing to kitco.com
- #5,171
- Jan 5, 2019 9:14am Jan 5, 2019 9:14am
- | Commercial User | Joined Dec 2014 | 14,163 Posts
https://www.kitco.com/news/2019-01-0...om-Powell.html
News Bites
Gold Bounces Off Lows Following 'Dovish' Comments From Powell
https://www.kitco.com/ind/NeilsChris...hristensen.jpg
Neils Christensen Friday January 04, 2019 11:39
Kitco News
Share this article:
https://www.kitco.com/news/2019-01-0...2d746d_z-1.jpg
Jerome Powel, Chair of the Federal Reserve
(Kitco News) - Gold remains under pressure Friday but is off its lows following what some economists have deemed as dovish comments from Federal Reserve Chair Jerome Powell.
Speaking at the American Economic Association's annual meeting in Atlanta, Powell struck an optimistic tone for 2019, saying that he expects to see labor-market strength continue into 2019. However, he added that the central bank is paying attention to market signals that are flashing downside risks.
He added that because of muted inflation pressures, the central bank can afford to be patient.
“We are listening sensitively to what markets are signaling and will take into considerations growing downside risks,” he said. “We will be able to adjust monetary policy quickly and flexibly should that be needed.”
Adam Button, senior currency strategist at Forexlive.com, said that Powell’s comments are a notable shift in his outlook.
“The line 'quickly' is especially notable, it's a dovish shift. He's basically putting on a Powell put,” he said.
Powell also walked back part of his comment in December that the Federal Reserve’s balance-sheet reduction plan is on “autopilot,” which spooked equity markets significantly.
He said that the Federal Reserve would not “hesitate to make a change” to the balance-sheet reduction if data showed that it was harming U.S. economic growth.
Paul Ashworth, chief U.S. Economist at Capital Economics agreed that Powell comments were on the dovish side; however, he added that the Fed appears to be adjusting its view in light of the growing market turmoil.
“We all the market volatility we have seen it’s not surprising to see a bit of a change in stance from the Fed,” he said.
Ashworth also added that he doesn’t expect Powell’s comments to shift the central bank’s plan to raise interest rates two more times this year. Capital
Economics is expecting two rate hikes in the first half of the year before the central bank halts its current tightening cycle.
The U.S. dollar has lost some traction following Powell’s comments, which has benefited gold prices. February gold futures last traded at $1.286.70 an ounce, down 0.63% on the day. Prior to Powell’s comments, gold was down more than 1% as markets reacted to a blockbuster employment report, which showed that 312,000 jobs were created in December.
https://www.tradingview.com/x/vn7UiGO0/
By Neils Christensen
For Kitco News
- #5,172
- Jan 5, 2019 9:17am Jan 5, 2019 9:17am
- | Commercial User | Joined Dec 2014 | 14,163 Posts
https://www.zerohedge.com/news/2019-...ops+to+zero%29
President Xi Orders Chinese Army To "Prepare For War"
https://www.zerohedge.com/sites/defa...?itok=LY4e264-
by Tyler Durden
Sat, 01/05/2019 - 09:40
In just a few short days, China has proved that investors who have been underestimating the geopolitical risks stemming from the simmering tensions between the US and China over the latter's territorial claims in the South China Sea and paranoia over the fate of Taiwan - a de facto independent state that President Xi Jinping is aggressively seeking to bring under the heel of Beijing - have done so at their own peril.
Earlier this week Xi Jinping, the Chineseemperor for life president provoked an angry rebuke from Taiwan's pro-independence president when he demanded during a landmark speech earlier this week that Taiwan submit to "reunification" with Beijing.
And as if tensions between China and the international community weren't already high enough amid a worsening economic slowdown that's hurting global economic growth and a tenuous trade "truce" with the US, in another speech delivered on Friday during a meeting of top officials from China's Central Military Commission which he leads, Xi took his belligerent rhetoric one step further by issuing his first military command of 2019: that "all military units must correctly understand major national security and development trends, and strengthen their sense of unexpected hardship, crisis and battle."
"The world is facing a period of major changes never seen in a century, and China is still in an important period of strategic opportunity for development,” Xi said and added that China’s armed forces must "prepare for a comprehensive military struggle from a new starting point," Xi saidadding that "preparation for war and combat must be deepened to ensure an efficient response in times of emergency."
Xi's order prioritizes training with a focus on combat readiness, drills, troop inspections and resistance exercises.
It applies to all units of the PLA, including troops, academies and armed police, and is designed to "ensure new challenges are met and battles are won," according to a copy of the guidelines seen during the television report.
In other words, Xi just ordered the Chinese military to prepare for war.
According to the South China Morning Post, the order "will kick-start a year of enhanced military training and exercises." Which, of course, will build on the expansive military exercises carried out in 2018, where China flexed its military muscle in the South China Sea and Strait of Taiwan to show foreign powers that might support Taiwanese independence (i.e. the US) that China still takes the "One China" policy very, very seriously.
In addition to prioritizing training for military readiness, the CMC issued a separate set of guidelines intended to boost morale, affirming that military personnel would be promoted on the basis of merit while promising greater leniency and understanding for mistakes made during training.
As one Chinese "military expert" quoted by the SCMP pointed out, the order was probably intended as a warning to foreign powers who might try to interfere in its affairs.
Shanghai-based military expert Ni Lexiong said the recent "high-profile gestures" were probably intended as a warning to those who sought to obstruct the mainland’s plans for the reunification of Taiwan.
"[They] show how seriously Xi is taking China’s military training and its preparations for war, while also flexing its strength," he said.
A former PLA officer was more explicit: a retired PLA colonel Yue Gang said that as well as the rising tensions between Beijing and Taipei, Xi’s rallying call to the military was a response to the growing uncertainty over the geopolitical struggle between China and the United States.
"China is increasing its military training so that it has the best solutions for the worst outcomes, either related to the US or across the [Taiwan] strait," he said.
"Over the coming year, the US might use Taiwan and the South China Sea as bargaining chips to get what it wants from China with regards to the trade war," he said.
"And there is always the possibility of increased independence calls from Taiwan."
Meanwhile, China’s People’s Daily, the official publication of the Communist Party, reported Thursday that the PLA has begun an extensive "realistic training exercise" with live fire in Shandong, eastern China. The publication did not specify what the objective of this live-fire exercise was, nor did Chinese agencies report whether Xi mentioned any particular acts to improve combat readiness that the PLA either has already begun to take or will do so in the future.
That same day, the nationalistic Chinese state-run Global Times highlighted comments by acting Pentagon chief Patrick Shanahan, who told reporters that his top priorities were “China, China, China.” The publication warned American officials against anti-Chinese “paranoia” while also threatening to make America “pay an unbearable price if the U.S. infringes on China.”
“When Shanahan shouts ‘China, China, China,’ Beijing must respond by accelerating construction of a deterrent against the U.S. China must make good use of deterrence, learning to make others feel fearful without being furious."
Despite these explicit warnings and military ambitions, we are confident that in the eyes of the market and general population, the prospects for a prolonged "trade war" with China will remain completely distinct from speculation about the possibility of a hot war - that is, until it's too late to heed the warnings from US military personnel in the Pacific, who have been outspoken about the threat posed by the Chinese and their growing military ambitions.
COMMENTS FROM Benjaminis: WAR is definitely not out of the picture.
President Xi Orders Chinese Army To "Prepare For War"
https://www.zerohedge.com/sites/defa...?itok=LY4e264-
by Tyler Durden
Sat, 01/05/2019 - 09:40
In just a few short days, China has proved that investors who have been underestimating the geopolitical risks stemming from the simmering tensions between the US and China over the latter's territorial claims in the South China Sea and paranoia over the fate of Taiwan - a de facto independent state that President Xi Jinping is aggressively seeking to bring under the heel of Beijing - have done so at their own peril.
Earlier this week Xi Jinping, the Chinese
And as if tensions between China and the international community weren't already high enough amid a worsening economic slowdown that's hurting global economic growth and a tenuous trade "truce" with the US, in another speech delivered on Friday during a meeting of top officials from China's Central Military Commission which he leads, Xi took his belligerent rhetoric one step further by issuing his first military command of 2019: that "all military units must correctly understand major national security and development trends, and strengthen their sense of unexpected hardship, crisis and battle."
"The world is facing a period of major changes never seen in a century, and China is still in an important period of strategic opportunity for development,” Xi said and added that China’s armed forces must "prepare for a comprehensive military struggle from a new starting point," Xi saidadding that "preparation for war and combat must be deepened to ensure an efficient response in times of emergency."
Xi's order prioritizes training with a focus on combat readiness, drills, troop inspections and resistance exercises.
It applies to all units of the PLA, including troops, academies and armed police, and is designed to "ensure new challenges are met and battles are won," according to a copy of the guidelines seen during the television report.
In other words, Xi just ordered the Chinese military to prepare for war.
According to the South China Morning Post, the order "will kick-start a year of enhanced military training and exercises." Which, of course, will build on the expansive military exercises carried out in 2018, where China flexed its military muscle in the South China Sea and Strait of Taiwan to show foreign powers that might support Taiwanese independence (i.e. the US) that China still takes the "One China" policy very, very seriously.
In addition to prioritizing training for military readiness, the CMC issued a separate set of guidelines intended to boost morale, affirming that military personnel would be promoted on the basis of merit while promising greater leniency and understanding for mistakes made during training.
As one Chinese "military expert" quoted by the SCMP pointed out, the order was probably intended as a warning to foreign powers who might try to interfere in its affairs.
Shanghai-based military expert Ni Lexiong said the recent "high-profile gestures" were probably intended as a warning to those who sought to obstruct the mainland’s plans for the reunification of Taiwan.
"[They] show how seriously Xi is taking China’s military training and its preparations for war, while also flexing its strength," he said.
A former PLA officer was more explicit: a retired PLA colonel Yue Gang said that as well as the rising tensions between Beijing and Taipei, Xi’s rallying call to the military was a response to the growing uncertainty over the geopolitical struggle between China and the United States.
"China is increasing its military training so that it has the best solutions for the worst outcomes, either related to the US or across the [Taiwan] strait," he said.
"Over the coming year, the US might use Taiwan and the South China Sea as bargaining chips to get what it wants from China with regards to the trade war," he said.
"And there is always the possibility of increased independence calls from Taiwan."
Meanwhile, China’s People’s Daily, the official publication of the Communist Party, reported Thursday that the PLA has begun an extensive "realistic training exercise" with live fire in Shandong, eastern China. The publication did not specify what the objective of this live-fire exercise was, nor did Chinese agencies report whether Xi mentioned any particular acts to improve combat readiness that the PLA either has already begun to take or will do so in the future.
That same day, the nationalistic Chinese state-run Global Times highlighted comments by acting Pentagon chief Patrick Shanahan, who told reporters that his top priorities were “China, China, China.” The publication warned American officials against anti-Chinese “paranoia” while also threatening to make America “pay an unbearable price if the U.S. infringes on China.”
“When Shanahan shouts ‘China, China, China,’ Beijing must respond by accelerating construction of a deterrent against the U.S. China must make good use of deterrence, learning to make others feel fearful without being furious."
Despite these explicit warnings and military ambitions, we are confident that in the eyes of the market and general population, the prospects for a prolonged "trade war" with China will remain completely distinct from speculation about the possibility of a hot war - that is, until it's too late to heed the warnings from US military personnel in the Pacific, who have been outspoken about the threat posed by the Chinese and their growing military ambitions.
COMMENTS FROM Benjaminis: WAR is definitely not out of the picture.
- #5,173
- Edited 12:03pm Jan 5, 2019 11:44am | Edited 12:03pm
Attached Image (click to enlarge)
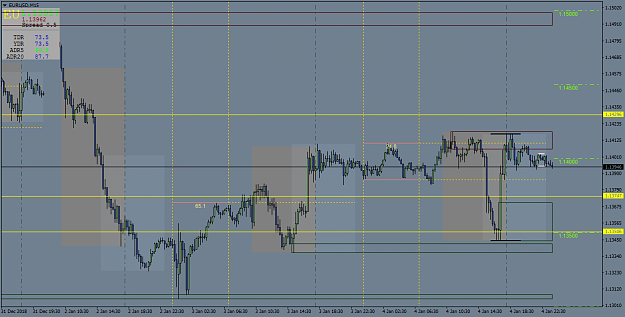
happy weekend,
Attached File(s)
i only use my ll supdem v2 indicator with my mt4 terminal (red and green rectangle),and news about stop and option in forexlive (yellow line)
so i dont trust any indicator besides supdem indi ( got a bad experience with them ).
this EURUSD M15 CHART, SUPPORT RESISSTANCE ON H1
THANKS
- #5,174
- Jan 5, 2019 12:16pm Jan 5, 2019 12:16pm
hi benj,
would you share about your "risk management"?
here that i understand is only TRADE MANAGEMENT and MONEY MANAGEMENT,maybe you would add about 'RISK MANAGEMENT.
money management, that i read on forum is about "position sizing".
trade management,is about sl/tp/exit ( risk reward ratio )
if i dont make a mistake,would clarify on this and explain about your risk management/trade management/money management.
thanks
- #5,175
- Jan 5, 2019 5:55pm Jan 5, 2019 5:55pm
- | Commercial User | Joined Dec 2014 | 14,163 Posts
https://mises.org/wire/depression-2019-2021
The Depression of 2019-2021?
The Depression of 2019-2021?
12/28/2018 Brendan Brown
The profound question which transcends all this day-to-day market drama over the holidays is the nature of the economic slowdown now occurring globally.
This slowdown can be seen both inside and outside the US. In reviewing the laboratory of history — especially those experiments featuring severe asset inflation, unaccompanied by high official estimates of consumer price inflation — three possible “echoes” deserve attention in coming weeks and months. (History echoes rather than repeats!)
Will We Learn from History — And What Will Soon Be History?
The behavioral finance theorists tell us that which echo sounds and which outcome occurs is more obvious in hindsight than to anyone in real time. As Daniel Kahneman writes (in Thinking Fast and Slow):
The core of hindsight bias is that we believe we understand the past, which implies the future should also be knowable; but in fact we understand the past less than we believe we do – compelling narratives foster an illusion of inevitability; but no such story can include the myriad of events that would have caused a different outcome .
Whichever historical echo turns out to be loudest as the Great Monetary Inflation of 2011-18 enters its late dangerous phase. Whether we're looking at 1927-9, 1930-3, or 1937-8, the story will seem obvious in retrospect, at least according to skilled narrators. There may be competing narratives about these events — even decades into the future, just as there still are today about each of the above mentioned episodes.
Even today, the Austrian School, the Keynesians, and the monetarists, all tell very different historical narratives and the weight of evidence has not knocked out any of these competitors in the popular imagination.
The Stories We Tell Ourselves Are Important
And while on the subject of behavioral finance’s perspectives on potential historical echoes and actual market outcomes, we should consider Robert Shiller’s insights into story-telling (in “Irrational Exuberance”):
Speculative feedback loops that are in effect naturally occurring Ponzi schemes do arise from time to time without the contrivance of a fraudulent manager.
Even if there is no manipulator fabricating false stories and deliberately deceiving investors in the aggregate stock market, tales about the market are everywhere….. The path of a naturally occurring Ponzi scheme – if we may call speculative bubbles that – will be more irregular and less dramatic since there is no direct manipulation but the path may sometimes resemble that of a Ponzi scheme when it is supported by naturally occurring stories.
Bottom line: great asset inflations (although the term "inflation" remains foreign to Shiller!) are populated by “naturally occurring Ponzi schemes,” with the most extreme and blatant including Dutch tulips, Tokyo golf clubs, Iceland credits, and Bitcoins; the less extreme but much more economically important episodes in recent history include financial equities in 2003-6 or the FANMGs in 2015-18; and perhaps the biggest in this cycle could yet be private equity.
Echoes of Past Crises
First, could 2019-21 feature a loud echo of 1926-8 (which in turn had echoes in 1987-9, 1998-9, and 2015-17)?
The characteristic of 1926-8 was a “Fed put” in the midst of an incipient cool-down of asset inflation (along with a growth cycle slowdown or even onset of mild recession) which succeeds apparently in igniting a fresh economic rebound and extension/intensification of asset inflation for a while longer (two years or more). In mid-1927 New York Fed Governor Benjamin Strong administered his coup de whiskey to the stock market (and to the German loan boom), notwithstanding the protest of Reichsbank President Schacht).
The conditions for such a Fed put to be successful include a still strong current of speculative story telling (the narratives have not yet become tired or even sick); the mal-investment and other forms of over-spending (including types of consumption) must not be on such a huge scale as already going into reverse; and the camouflage of leverage — so much a component of “natural Ponzi schemes” — must not yet be broken. The magicians, otherwise called “financial engineers” still hold power over market attention.
Most plausibly we have passed the stage in this cycle where such a further kiss of life could be given to asset inflation. And so we move on to the second possible echo: could this be 1937-8?
There are some similarities in background. Several years of massive QE under the Roosevelt Administration (1934-6) (not called such and due ostensibly to the monetization of massive gold inflows to the US) culminated in a stock market and commodity market bubble in 1936, to which the Fed responded by effecting a tiny rise in interest rates while clawing back QE. Under huge political pressure the Fed reversed these measures in early 1937; a weakening stock market seems to reverse. But then came the Crash of late Summer and early Autumn 1937 and the confirmed onset of the Roosevelt recession (roughly mid-1937 to mid-1938). This was even more severe than the 1929-30 downturn. But then there was a rapid re-bound.
On further consideration, there are grounds for skepticism about whether the 1937-8 episode will echo loudly in the near future.
In 1937 there had been barely three years of economic expansion. Credit bubbles and investment spending bubbles (mal-investment) were hardly to be seen.
And the monetary inflation in the US was independent and very different from monetary conditions in Europe, where in fact the parallel economic downturn was very mild if even present. And of course the re-bound had much to do with military re-armament.
It is troubling that the third possible echo — that of the Great Depression of 1930-2 — could be the most likely to occur.
The Great Depression from a US perspective was two back-to-back recessions; first the severe recession of autumn 1929 to mid-1931; and then the immediate onset of an even more devastating downturn from summer 1931 to summer 1932 (then extended by the huge uncertainty related to the incoming Roosevelt Administration and its gold policy).
It was the global credit meltdown — the unwinding of the credit bubble of the 1920s most importantly as regards the giant lending boom into Germany — which triggered that second recession and snuffed out a putative recovery in mid-1931.
It is possible to imagine such a two-stage process in the present instance.
Equity market tumble accompanies a pull-back of consumer and investment spending in coming quarters. The financial sector and credit quakes come later as collateral values plummet and exposures come into view. In the early 1930s the epicentre of the credit collapse was middle Europe (most of all Germany); today Europe would also be central, but we should also factor in Asia (and of course China in particular).
And there is much scenario-building around the topics of ugly political and geo-political developments that could add to the woes of the global downturn.
Indeed profound shock developments are well within the normal range of probabilistic vision in the UK, France and Germany — a subject for another day. And such vision should also encompass China.
Brendan Brown is the Head of Economic Research at Mitsubishi UFJ Securities International.
- #5,176
- Jan 5, 2019 6:18pm Jan 5, 2019 6:18pm
- | Commercial User | Joined Dec 2014 | 14,163 Posts
https://www.goldmoney.com/research/g...ll-about-flows
Markets are all about flows
By Alasdair Macleod
Goldmoney Insights January 03, 2019
This article looks at prospective supply and demand factors for financial assets in the New Year and beyond. Investors should take into account money flowing into and out of financial assets as well as stock flows, particularly escalating government bond issuance, which looks likely to accelerate significantly in the coming years. It adds up to the fundamental case for physical gold and silver.
At this time of year, the thoughtful soul considers prospects for markets. Pundits are laying out their forecasts, and they fall into two broad camps. There are brokers and fund managers who talk of value. Their income and assets under management depend on continually inflating prices. Then there are the pessimists, a ragbag of doom-mongers who sweepingly point to risks on a grand scale. The collapse of Italy, Deutsche Bank, China, Brexit… take your pick. Very few engage on the subject that really matters, and that is the underlying monetary flows into and out of financial markets.
We must assess the pace of monetary expansion relative to the demand for money and credit, and where that expansion goes. Early in the credit cycle, there is little demand from the non-financial sector for monetary expansion, so excess money and bank credit go into the financial sector, pushing up financial asset prices. As the cycle progresses, it begins to be demanded by the non-financial economy and money then flows from the financial sector to non-financials. This is why we have observed that just as business conditions in the real economy start improving, just as valuations begin to be vindicated, interest rates and bond yields start rising and shares enter a bear market.
It should be noted that while some shares are sure to rise reflecting specific corporate developments and investor focus, money draining from financial markets has the same effect as air draining from a leaking balloon. They deflate, and taken as a whole, prices of both bonds and equities persistently decline.
Interest rates begin to rise when the monetary expansion earlier in the cycle finds its way into the non-financial economy, inflating prices of goods and services instead of financial assets. More money ends up chasing the same quantity of manufactured goods and services, and their prices rise without an increase in demand. It is this effect which confuses those who can only equate rising prices with increased demand.
But for investors, the important effect of the evolving credit cycle is that it begins to limit the flow of new money into financials, relative to the money exiting into the non-financial economy. It is the balance of these flows which basically determines market values as a whole. The pessimists, many of whom will have been forecasting the imminent demise of stockmarkets through the whole bull run, at last have a chance of being right, because of the knock-on effects of falling financial asset values. And it must be borne in mind that in the absence of new money flowing to support financial asset prices, there are always marginal sellers who will drive prices lower.
The supply of government debt will increase
Besides the ebbing away of money supply from financials into the real economy, we must also consider the effect of stock flows on financial prices, the most significant being changes arising from the financing of government deficits. In a conventional Keynesian economic model, the government stimulates the economy by deliberately engineering a budget deficit early in the cycle. As economic activity recovers, tax revenues improve, and government finances return to a surplus. Therefore, according to Keynes’s theory, demand for capital evens out over the cycle as a balance is restored towards the end of it.
This idealised setup is no longer the case. The last US budget surplus was eighteen years ago in 2000. Since then the US economy has had a bust, followed by a boom, another bust and in 2017-18 was in its second boom. The accumulated budget deficits since 2000 total $12.454 trillion and government debt has increased from $5.674 trillion to $21.516 trillion.[i] Whatever one thinks of Keynesian interventionism, the abuse by the US Government of Keynes’s theory of the state’s management of the economy is truly staggering, and seems set to drive it into a debt trap that can only result in either a severe retrenchment of state spending or the eventual destruction of the state’s currency.
So far, investors have ignored this underlying trend. They have happily taken the combination of zero interest rates and monetary expansion and invested in financial assets, including all the government debt on offer. The money and credit have been issued for them to do this, but it cannot continue for ever. Monetary inflation has led to many governments adding to their debt obligations throughout the whole credit cycle, so the affordability to governments of future debt issues is bound to become an issue.
The rule of thumb employed by economists in the past has been to compare growth in GDP with the interest cost of government funding. This presupposes that GDP growth leads to higher tax revenues, and as long as the increase in tax revenues is expected to cover the interest cost of the increased debt, the debt is deemed affordable.
Governments have benefited from this relationship in recent credit cycles, not through increases in GDP, but through the suppression of interest rates. This is particularly dangerous, because a debt trap will almost certainly be sprung when that unnatural suppression comes to an end. It also assumes that economic growth continues with little variation. It cannot apply to countries heavily exposed to the volatility of commodity prices, particularly emerging economies, nor is it viable in the real world of increasingly destabilising credit cycles evident in consumer-driven welfare states.
The next two sections in this article will concentrate on the debt position of the US, on the basis that the dollar is the world’s reserve currency, and international markets reference prices in dollars. An acceleration of debt supply from the US Government is likely to dominate global investment flows and financial valuations in the next decade, so we should try to quantify them.
When considering the US Government’s debt, it must be noted that roughly one-third is held by the government itself in accounts such as the Social Security Trust Fund. However, they represent funding of external welfare obligations, so are external liabilities for the Federal Government. For the purposes of this debt analysis, they will be dealt with the same way as other public obligations, rather than as a purely technical internal government arrangement, which is the assumption of the Congressional Budget Office from which much of our information is drawn.
The threat of a US Government debt trap
The issuance of debt is normally subject to a contract that it will be repaid at the end of its term, along with the coupon interest. The exception is undated bonds, when only the interest contract must be fulfilled. In practice, governments and many corporations roll over debt into new bond obligations at the end of their terms, but at least bondholders have the opportunity to be repaid their capital. Therefore, the credibility of government debt is based on the assumption the issuer can afford to continue to roll it over rather than repay it.
However, the rolling over of old debts and the continual addition of new ones will almost certainly become a problem for governments everywhere. It is less of a problem when the debt is put to productive use, but that is rarely, if ever, the case with government finances. To judge whether the rolling over of debt is sustainable and at what cost, we need to rely on other metrics. The traditional method is to compare outstanding debt with GDP, and by using this approach two economists (Carmen Reinhart and Ken Rogoff) came up with a rule of thumb, that once a government’s debt to GDP ratio exceeded approximately 90%, economic growth becomes progressively impaired.[ii]
The Reinhart-Rogoff paper was empirically based, and loosely impresses upon us that the current situation for the US and other nations with higher debt to GDP ratios is unsustainable. Key to this reasoning is that rising debt levels divert savings from financing economic growth, and therefore a government’s ability to service it from rising taxes is undermined. At the Rubicon level of 90% and over, median growth rates in the countries sampled fell by 1%, and their average growth rates by “considerably more”. It is entirely logical that a government forced to tax its private sector excessively in order to pay debt interest will restrict economic potential overall.
This analysis was published in the wake of the Lehman crisis, when an unbudgeted acceleration in the rate of increase of government debt everywhere was a pressing concern. The signals from financial markets today indicate that we could be on the verge of a new credit crisis, in which case tax revenues will again fall below existing estimates, and welfare costs rise above them. Therefore, government debt will increase unexpectedly, as was the case that caused the Reinhart-Rogoff paper to be published in 2010.
To look at the increase of government debt between 2007 and 2009, as Reinhart-Rogoff did, was not, as it turned out, a long enough time-frame to fully reflect the consequences of the Lehman crisis on government debt. The increase recorded over 2007-09 was 32%, yet economists and others were still talking of austerity until only recently. The whole period between the Lehman crisis and the election of President Trump is perhaps a better time-frame, and we see that US Government debt between 2007 and 2016 increased by an astonishing 217%.
It turns out that the Reinhart-Rogoff report severely understated the problem by reporting early. Their 90% debt to GDP Rubicon has been left behind anyway, with government debt to GDP ratios around the world in excess of 100% becoming common. In the case of the US, total Federal debt, including intragovernmental holdings, is currently over 105% and rising. The Congressional Budget Office is forecasting substantial budget deficits out to 2028, adding an estimated further $4.776 trillion in deficits between fiscal 2019-23, or $9.446 trillion between fiscal 2019-28.[iii]
This assumes there is no credit crisis, so for those of us who know there will be one during the next ten years, these numbers are far too optimistic. Accordingly, we should look at two possible outcomes: first, a best case where price inflation continues to be successfully managed with a target rate of two per cent, and a second base case incorporating an estimate of the effects of the next credit cycle on government finances.
Best and base case outcomes
Our best-case outcome of controlled price inflation is essentially that forecast by the Congressional Budget Office. Working from the CBO’s own figures, by 2023 we can estimate accumulated debt including intragovernmental holdings will be $26.3 trillion[iv] including our estimated interest cost totalling $1.3 trillion[v].
That is our best case. Now let us assume the more likely outcome, our base case, which is where the effects of a credit cycle play a part. This will lead to a fall in Federal Government receipts and an increase in total expenditures. Taking the last two cycles (2000-07 and 2007-18) these led to increases in government debt of 59% and 239% respectively. Therefore, it is clear that borrowing has already been accelerating rapidly for a considerable time due in large measure to the destabilising effect of increasingly violent credit cycles. If the next credit cycle only matches the effects on government finances of the 2007-18 credit cycle, government debt including intragovernmental holdings can be expected to rise to $51.4 trillion by 2028. This compares with the CBO’s implied forecast of only $34 trillion of government debt over the same time-frame and makes no allowance for the cyclical effect on interest rates. More on interest rates later.
Because the underlying trend is for successive credit cycles to worsen, the $51.4 trillion figure for federal Government debt becomes a base figure from which to work. But there are still considerable uncertainties, particularly over the form it will take.
The character of the next credit cycle is unlikely to replicate the last one, which was a sudden financial and systemic shock. Today, the US banking system is better capitalised and off-balance sheet securitisation has been brought largely under control. There are however, uncertainties concerning the Eurozone banking system. There are also risks in global derivatives markets and the potential knock-on effects of counterparty failures on the US banks. Furthermore, there can be little doubt the sudden systemic shock of Lehman afforded a degree of protection for the purchasing power of the dollar, and therefore of the other mainstream currencies, despite the unprecedented monetary expansion.
However, it would be complacent to expect an outcome of relatively low price-inflation to be simply repeated at a time when government finances are even more dramatically spiralling out of control. Last time the threat was systemic to the banks, but next time the inflationary consequences of government finances is likely to be the dominant problem.
The explosion in the quantity of government debt that our analysis implies has many economic consequences. In the context of our rough analysis we should comment on the point made in the original Reinhart-Rogoff paper, which is that the reduction in GDP potential that results from an increase in the ratio of government debt to GDP is likely to be significant. The growth in Federal debt that replicates the post-Lehman experience will leave the US Government with a debt to GDP ratio of over 170%. The CBO assumes GDP will increase by 48% by 2028 to $29.803 trillion, whereas our cyclical case is for debt to rise to $51.4 trillion. While both these figures should be taken as purely indicative, clearly, US Government debt will increase at a faster pace than the growth in GDP and will strangle economic activity.
If the purchasing power of the dollar declines more rapidly than implied by the CBO’s assumed 2% price inflation target, interest payable on Federal debt will in turn be sharply higher than expected, compounding the debt problem. The Federal Government will face a potentially terminal debt trap from which there can be no escape.
Flows v purchasing power
On the face of it, bulls in financial markets will face an uphill struggle if they are to make money during the next credit cycle, given the prospect and consequences of an increasing supply of government debt. It is the diminishing flows into and increasing flows out of financial markets, together with the escalating demand for funding from governments that will decide the outcome.
When these parallel conditions developed in the UK between 1972-74, the FT 30 Index lost 73% of its value, or 80% allowing for price inflation. Collapsing asset values hit leveraged loans and a commercial property collapse ensued, taking out the secondary banks. A long-dated gilt (government bond) with a twenty-year maturity was issued with a coupon of 15.25% in 1976. That was great for the pension funds who loved the income stream, but ordinary investors were wiped out. The conditions today not only rhyme with this history on a global scale, but there is a worrying degree of replication becoming evident in US financial markets.
We have seen from the above analysis that demand for investors’ money from cash-strapped governments is almost certain to accelerate. The example taken of the US Government’s prospective finances is by no means the worst culprit. All major governments running welfare states are likely to increase their bond issuance in the next few years, particularly, as seems increasingly likely, if the investing world is on the verge of another credit crisis that threatens individual economies.
Members of the Eurozone particularly risk these destabilising difficulties. The ropy finances of Greece, Italy, Portugal and Spain have been well publicised. But we must include France, with her rapidly deteriorating finances as well.
There has always been the option for the central banks to open up the money supply tap. But to do that in addition to the post-Lehman monetary expansion still in the system risks undermining the purchasing power of their unbacked currencies. Price inflation is already no longer something that can be dismissed by hedonics, product-switching and repackaging goods into smaller quantities. Ordinary people and businesses will increasingly baulk at the low levels of time preference that do not take real price inflation adequately into account. Therefore, it is hard to see how central banks will be able to suppress interest rates in the way they have managed in the past. That was the hard lesson learned in the UK in the 1970s: The Bank of England had higher interest rates forced upon it by markets, eventually peaking at 17% in 1979.
It is challenging to see how governments can escape from their debt traps when interest rates rise above the levels currently assumed likely by both investors and government agencies. It will take, at a minimum, substantial cuts in government spending, which comes unnaturally to governments used to low-cost money being available on demand. The effect of high compounding interest will make government finances considerably worse than outlined in this article.
Investors faced with deteriorating prospects for government finances will therefore avoid financial assets, switching to tangibles. Top of the list are solid money in the form of gold, and also silver. Commodities might fall in price in real terms (i.e. priced in gold) but will rise priced in government currencies. Residential property will be hit by rising mortgage rates, but homeowners who survive the initial fall in prices are likely to be rescued by the bankruptcy of their lenders.
The ranking of hedges compared with deposits payable in bankrupt government currencies will become increasingly important to those trying to protect their savings. Worst case is a crack-up boom, but let’s leave that one for another time.
[i] All figures extracted from St Louis Fed’s FRED.
[ii] Growth in a Time of Debt Carmen Reinhart and Kenneth Rogoff, NBER Working Paper No. 15639, 2010. See https://www.nber.org/papers/w15639.pdf
[iii] See Table 2 at https://www.cbo.gov/system/files?fil...84-apb2019.pdf
[iv] The CBO estimates of debt and debt interest are based on debt in public hands only. They exclude $5.8 trillion of debt held in intragovernmental accounts, which are included in debt ceiling calculations and my estimates.
[v] This includes estimated interest on intragovernmental debt, which is not in the CBO’s figures, and assumes an increase in average nominal funding costs of 3.25% by 2022, which is a real rate of 1.25% at 2% price inflation. This further assumes the deflator accurately captures the rate of price inflation, which it certainly does not.
The views and opinions expressed in this article are those of the author(s) and do not reflect those of Goldmoney, unless expressly stated. The article is for general information purposes only and does not constitute either Goldmoney or the author(s) providing you with legal, financial, tax, investment, or accounting advice. You should not act or rely on any information contained in the article without first seeking independent professional advice. Care has been taken to ensure that the information in the article is reliable; however, Goldmoney does not represent that it is accurate, complete, up-to-date and/or to be taken as an indication of future results and it should not be relied upon as such. Goldmoney will not be held responsible for any claim, loss, damage, or inconvenience caused as a result of any information or opinion contained in this article and any action taken as a result of the opinions and information contained in this article is at your own risk.
- #5,177
- Jan 5, 2019 7:19pm Jan 5, 2019 7:19pm
- | Commercial User | Joined Dec 2014 | 14,163 Posts
Inserted Video
PLEASE TAKE THE HOUR TO WATCH THE INTERVIEW.
I Promise you that you will learn things that you most likely were not aware of.
It is important for your future to be AWARE.
Then we can discuss solutions or how best to protect yourself and your loved ones.
PLEASE LISTEN and share your thoughts and or questions here and I will be glad to answer any question that you have.
Good Evening.
Benjaminis
BWM
- #5,179
- Jan 5, 2019 7:34pm Jan 5, 2019 7:34pm
- | Commercial User | Joined Dec 2014 | 14,163 Posts
Inserted Video
- #5,180
- Jan 5, 2019 8:49pm Jan 5, 2019 8:49pm
- | Commercial User | Joined Dec 2014 | 14,163 Posts
Inserted Video
Another Great Analyst Explaining Things In A Way That is easy to understand. By knowing this you can trade with the trend in your Forex trading plans.
Please post any questions, Deflationary Depression with Deflation in Asset Prices and Inflation in hard goods. It all leads to a world depression with NO SOLUTIONS other than a complete collapse of the present financial system globally and then a RESET !!!
Benjaminis
BWM