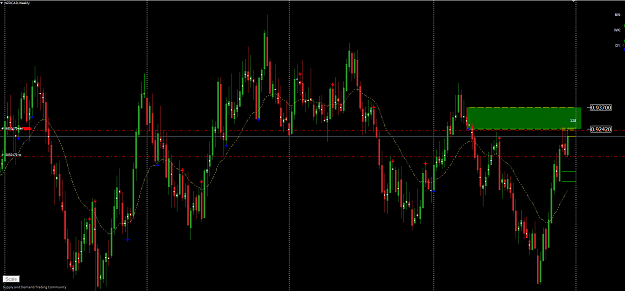
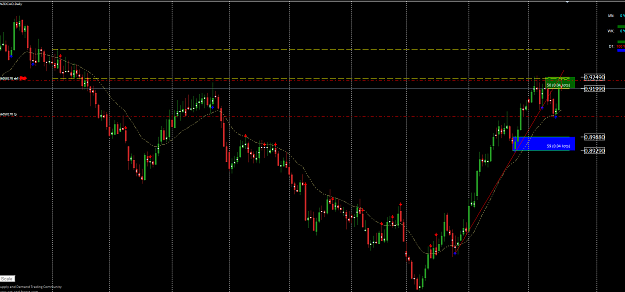
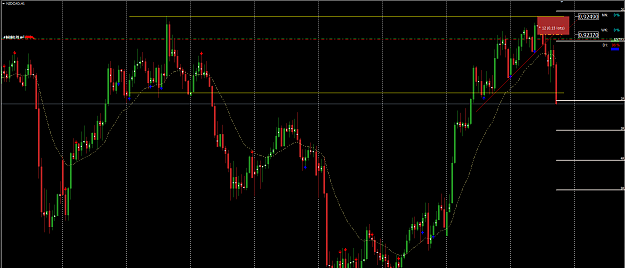
hi guys NZDCAD short trade as discoursed with the guys on the storehouse analytics roundtable team..... currently at 2:1, and stoploss moved to BE... cheers {image} {image} {image}
Ignored
Hey bleeze, did you move stoploss above new supply that was created on 1h tf, is it correct?
And did you swiched timeframes and trading style from short trades to more longer?
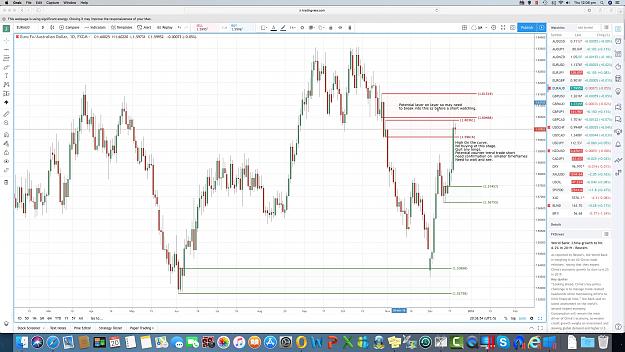
Hi Team i have been watching the EURAUD any feed back on this would be welcomed.
Have daily as curve chart which is up but in SZ zone with layer above so may need to break through for counter trend to occur.
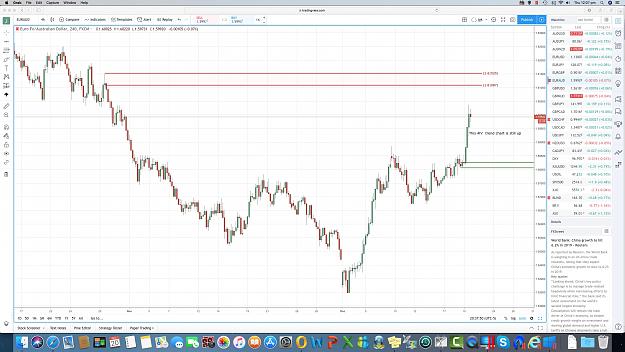
My trend chart the 4 Hr shows no sign at this stage it still in fact has potential to come back to DZ zone and go again.
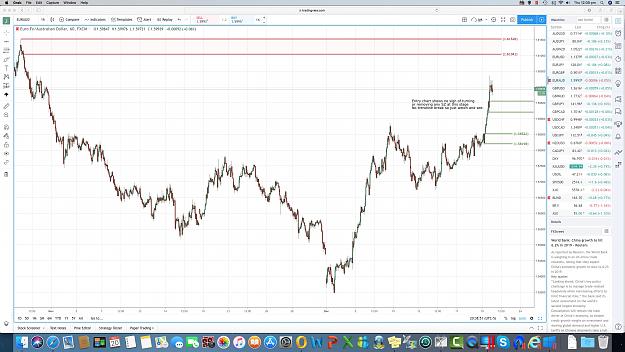
Entry Chart 60 min also shows no sign of removing and SZ at this stage. So just observing given curve has hit SZ on Curve timeframe.
ozzyman85 i loved you explanation of authentic and associated zones nice and clear for me.
Any feedback folks would be appreciated.
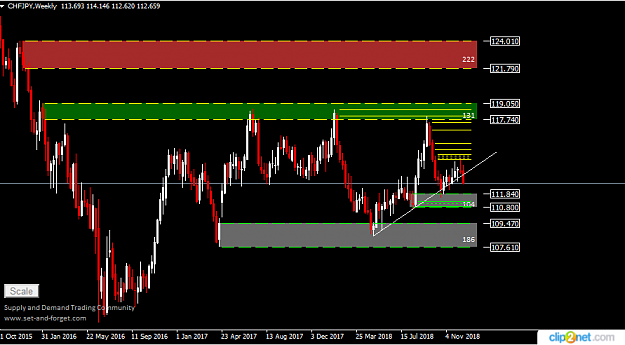
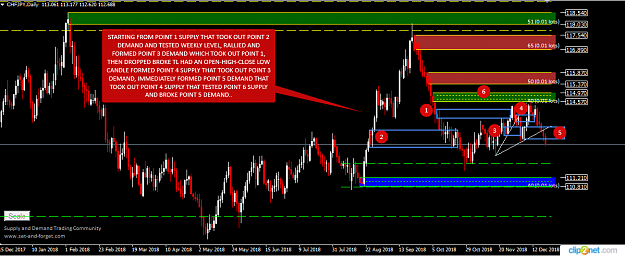
Hello guys, my analysis on CHFJPY weekly&daily chart.weekly chart looks straight forward,daily chart is where the talk is,my first opinion is on the chart below and my second opinion is to leave CHFJPY alone until it present a more straight forward outlook
Hi Team i have been watching the EURAUD any feed back on this would be welcomed. Have daily as curve chart which is up but in SZ zone with layer above so may need to break through for counter trend to occur. My trend chart the 4 Hr shows no sign at this stage it still in fact has potential to come back to DZ zone and go again. Entry Chart 60 min also shows no sign of removing and SZ at this stage. So just observing given curve has hit SZ on Curve timeframe. ozzyman85 i loved you explanation of authentic and associated zones nice and clear for me....
Ignored
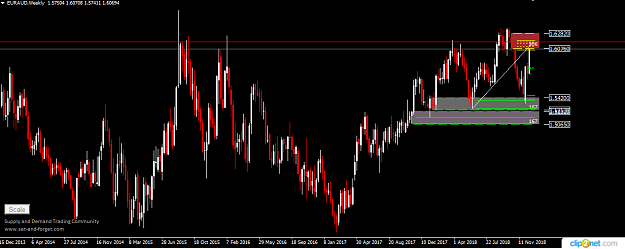
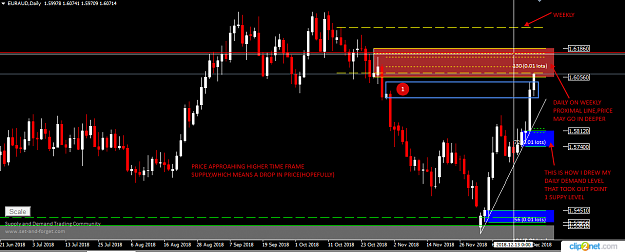
Hello jgk, my analysis on EURAUD weekly&daily below.
Hello guys, my analysis on CHFJPY weekly&daily chart.weekly chart looks straight forward,daily chart is where the talk is,my first opinion is on the chart below and my second opinion is to leave CHFJPY alone until it present a more straight forward outlook{image}{image}
Ignored
Hi Diddyy,
The fact that price has broken daily momentum TL means we cannot buy until we hit weekly demand zone now.
The conservative approach would be to wait for price to reach the non fresh demand below and we would anticipate a deeper penetration as well before long opportunities present themselves.
Aggressively you could short quality fresh 4h SZs providing the down momentum TL on the 4h doesn’t break
Hi MiyagiFX, Yes, tnx I learned it, but question was about that buying zone, sometimes I got confused when we can draw momentum line, and not taking out any real zones but zones of buying/selling, same for conformation trades, now I understand that any zone can be used real or not
{quote} Hi MiyagiFX, Yes, tnx I learned it, but question was about that buying zone, sometimes I got confused when we can draw momentum line, and not taking out any real zones but zones of buying/selling, same for conformation trades, now I understand that any zone can be used real or not
Ignored
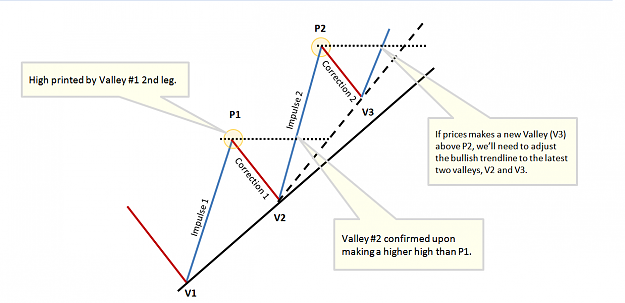
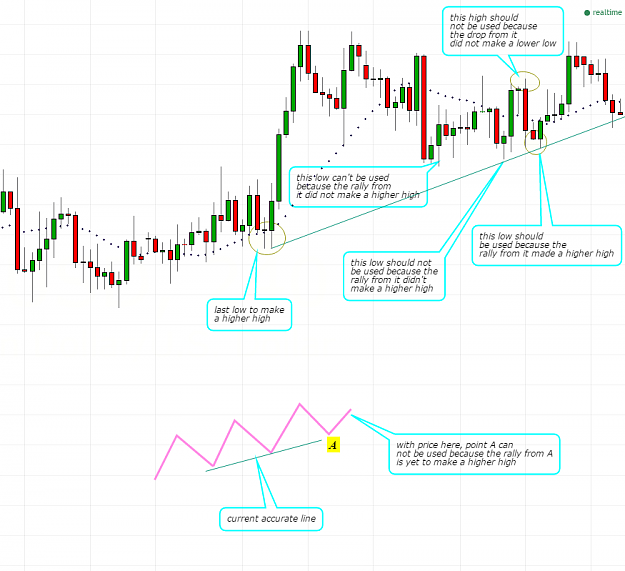
Drawing a TL doesn’t necessarily mean about removing any zones or buying areas for that matter, it is just about peaks and troughs. Yes there maybe zones or buying/selling areas at those peaks and troughs in the form of RBD and DBR but not always. Just as long as the last peaks troughs in price makes HHs and HLs for an uptrend and vice versa for a downtrend then we can draw a TL.
See the the image below - we can draw an up TL but there is no SZ or selling area being removed, just a bunch of mess
Attached Image (click to enlarge)
refer to the image I posted yesterday with the line chart. That is all you need. Don’t worry about removing zones or buying/selling areas, just HHs and HLs is all that matters when drawing TLs
Hi Team i have been watching the EURAUD any feed back on this would be welcomed. Have daily as curve chart which is up but in SZ zone with layer above so may need to break through for counter trend to occur. My trend chart the 4 Hr shows no sign at this stage it still in fact has potential to come back to DZ zone and go again. Entry Chart 60 min also shows no sign of removing and SZ at this stage. So just observing given curve has hit SZ on Curve timeframe. ozzyman85 i loved you explanation of authentic and associated zones nice and clear for me....
Ignored
whats up jgk,
yes we are at an area we want to be looking for selling opportunities. keep in mind we are counter trend it does not not look like we will be able to get 4hr confirmation so looking down into the 1hr is more aggressive. This is fine but something we say in the roundtable meetings/chat :aggressive doesn't mean bad it just means more aggressive."
{quote} whats up jgk, yes we are at an area we want to be looking for selling opportunities. keep in mind we are counter trend it does not not look like we will be able to get 4hr confirmation so looking down into the 1hr is more aggressive. This is fine but something we say in the roundtable meetings/chat :aggressive doesn't mean bad it just means more aggressive."
Ignored
hi ozzyman85
By dropping down 1 TF lower than your entry TF and being more aggressive with looking for a confirmation trade, would you use the opposing zone on this lower TF for TP areas providing there is room for a trade or still use your entry TF zones for TP areas?
{quote} Hi MiyagiFX, Yes, tnx I learned it, but question was about that buying zone, sometimes I got confused when we can draw momentum line, and not taking out any real zones but zones of buying/selling, same for conformation trades, now I understand that any zone can be used real or not
Ignored
whats up again ykn4f/Miyagifx
"clear as mud you could say right lol." keep up the great work.
i recommend to all to keep re-watching AKT videos on trendlines if you have any confusions on zones/ any rules. we never stop learning!
a little tip from my trading that i hope helps other, if you cant see where to draw the ML trendline or see quality zones just move onto the next chart.
you stare at a chart long enough the chart will tell you what you want to see... trade safe.
{quote} hi ozzyman85 By dropping down 1 TF lower than your entry TF and being more aggressive with looking for a confirmation trade, would you use the opposing zone on this lower TF for TP areas providing there is room for a trade or still use your entry TF zones for TP areas?
Ignored
it really depends on the trader Miyagi just keep in mind it is counter trend so maybe manage risk accordingly same with SL/TP
{quote} whats up again ykn4f/Miyagifx "clear as mud you could say right lol." keep up the great work. i recommend to all to keep re-watching AKT videos on trendlines if you have any confusions on zones/ any rules. we never stop learning! a little tip from my trading that i hope helps other, if you cant see where to draw the ML trendline or see quality zones just move onto the next chart. you stare at a chart long enough the chart will tell you what you want to see... trade safe.
Ignored
Yes, I totally agree.
"Fall in love with the process and the results will follow" - Bradley Whitf
{quote} Drawing a TL doesn’t necessarily mean about removing any zones or buying areas for that matter, it is just about peaks and troughs. Yes there maybe zones or buying/selling areas at those peaks and troughs in the form of RBD and DBR but not always. Just as long as the last peaks troughs in price makes HHs and HLs for an uptrend and vice versa for a downtrend then we can draw a TL. See the the image below - we can draw an up TL but there is no SZ or selling area being removed, just a bunch of mess {image} refer to the image I posted yesterday...
Hey MiyagiFX, I think you misunderstand me or maybe im bad at expresing myself on english, but my question to ozzyman85 was about how he determinated downtrend on that chart, I saw momentum down but not trend, and then i saw we took out buying zone I highlighted on that picture, and T4i confirmed me on that, I understand how to draw momentum line, there was a great example from Akt's posts, here it is
{quote} whats up again ykn4f/Miyagifx "clear as mud you could say right lol." keep up the great work. i recommend to all to keep re-watching AKT videos on trendlines if you have any confusions on zones/ any rules. we never stop learning! a little tip from my trading that i hope helps other, if you cant see where to draw the ML trendline or see quality zones just move onto the next chart. you stare at a chart long enough the chart will tell you what you want to see... trade safe.
Hi Team i have been watching the EURAUD any feed back on this would be welcomed. Have daily as curve chart which is up but in SZ zone with layer above so may need to break through for counter trend to occur. My trend chart the 4 Hr shows no sign at this stage it still in fact has potential to come back to DZ zone and go again. Entry Chart 60 min also shows no sign of removing and SZ at this stage. So just observing given curve has hit SZ on Curve timeframe. ozzyman85 i loved you explanation of authentic and associated zones nice and clear for me....
Ignored
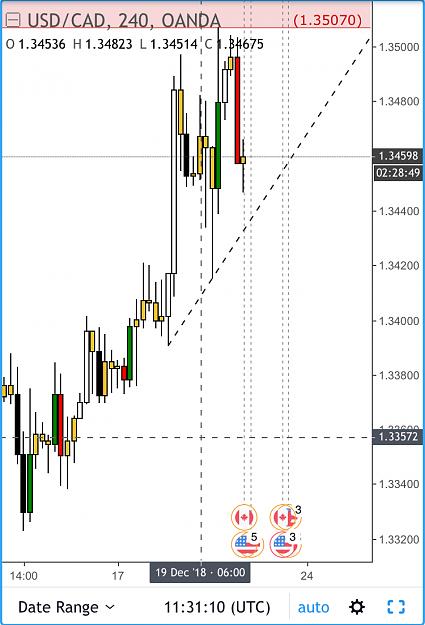
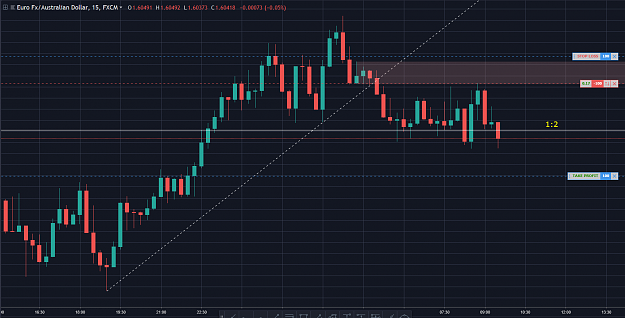
Hey jgk, I entered in this counter trend trade on tradingview demo account with conformation on 15m and it`s already 2:1
{quote} {quote} Hey MiyagiFX, I think you misunderstand me or maybe im bad at expresing myself on english, but my question to ozzyman85 was about how he determinated downtrend on that chart, I saw momentum down but not trend, and then i saw we took out buying zone I highlighted on that picture, and T4i confirmed me on that, I understand how to draw momentum line, there was a great example from Akt's posts, here it is {image}
Ignored
Ah ok ykn4f. I think we are going round in circles then lol.
Just as long as we are clear that momentum and trend are 2 different things. Most of the time they are in the same direction. We will see a change in momentum direction before a change in trend most of the time, unless price removes 2 opposing zones (which by the rules means a trend change) which will mean a change in momentum. By definition, trend can never change before momentum
{quote} {quote} Hey MiyagiFX, I think you misunderstand me or maybe im bad at expresing myself on english, but my question to ozzyman85 was about how he determinated downtrend on that chart, I saw momentum down but not trend, and then i saw we took out buying zone I highlighted on that picture, and T4i confirmed me on that, I understand how to draw momentum line, there was a great example from Akt's posts, here it is {image}
Ignored
Watch this video from the youtube channel of this thread.