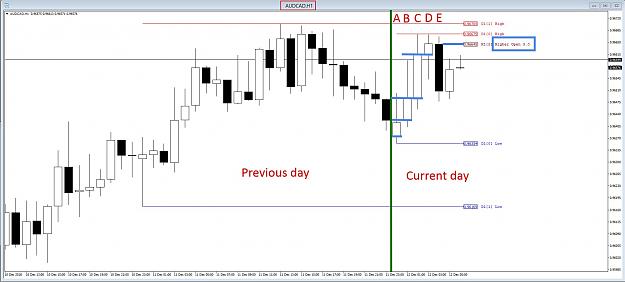
Disliked{quote} As for Higher Open, a part of the difficulty is when the lines move. When they move, like in the example above, one has to quickly figure out the new area of interest and wait for a valid signal. This is where the training of mind comes handy. Your advice from this post helps, https://www.forexfactory.com/showthr...75#post9007475 By the way, nice indicator to delineate pips by 5. Is it custom made and available for download?Ignored
Im a super noob to this, but I havent slept in 3 days back testing this and I think I might be able to help you out? So here goes.
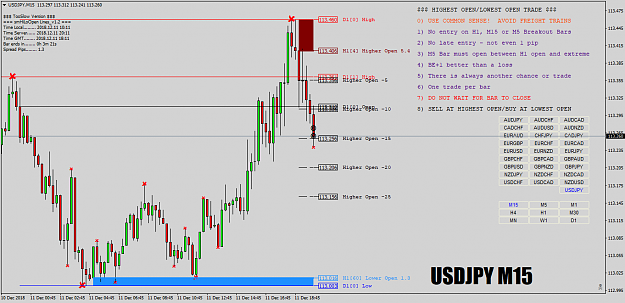
Say the market is making a new high based on the hourly time frame. We have a nice wick area of interest. Look at how the hourly candle closes. Was it bullish or bearish?
If the hourly closes bearish, then we have our highest open, therefore as price pushes through the open we get our click finger ready. If price drops under the open, take the trade. If price pushes and makes a new high, move on. Kinda.
Did the hourly candle close bullish? Wait another hour for a bearish candle and proceed like the above statement.
(if price doesn't push through the open of the bear candle, take the trade on the break of the h1 low. #RiskyRicky lol)
I took a sell on USDJPY based on TS's post. If you look at the H1, you'll see the bear candle based on what I just explained. It dropped about 4-5 pips. I was taken out at BE+2. I drilled down to M5 and looked for the same setup as my above statements.
Hope this helps!
2
![Click to Enlarge
Name: Entrance 2nd day - [USDJPY,M15].png
Size: 471 KB](/attachment/image/3128003/thumbnail?d=1544544913)
![Click to Enlarge
Name: Entrance 3rd day - [USDJPY,M15].png
Size: 402 KB](/attachment/image/3129366/thumbnail?d=1544636763)