{quote} What do you mean by timer? The graph already shows strength.
Ignored
Yes you are right about the timer. What do yo think off some percentage values like you have in Market filter e.g. 40% is above open and 60% is below open.
Reason is that I have observed that the colored graph lines can go alot far.
Anyway maybe I need to spend more time to learn reading it.
Update: S9_Basket_Trader_TS_v4 After reading one of the previous posts from a trader I realized that you couldn't add a TP or SL if you did a manual Buy or Sell. I fixed that so now you can. Re-download version 4 from the same downlink.
Ignored
Thank you Eugene- that was me.
Downloaded and fired up.
Things were pretty quiet overnight so I don't have anything worth showing today.........
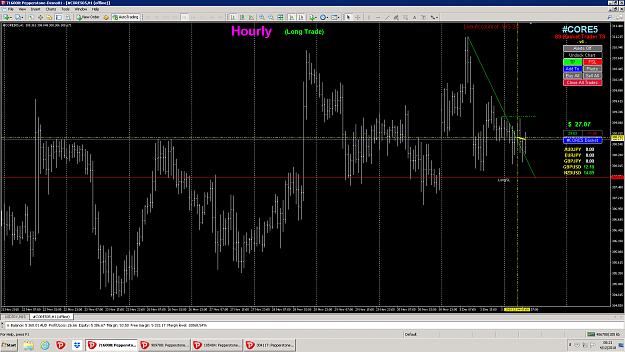
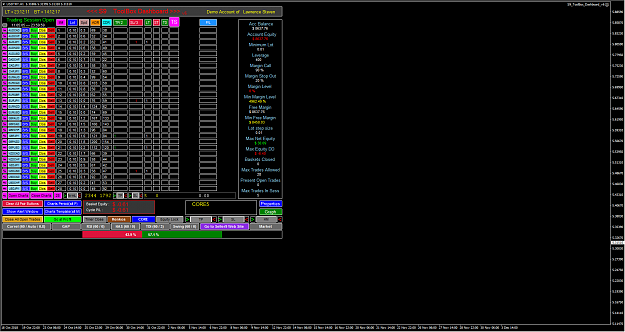
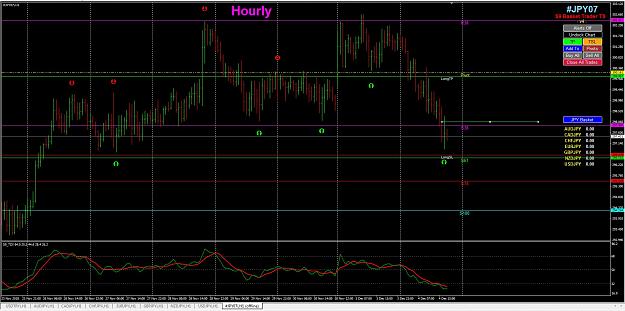
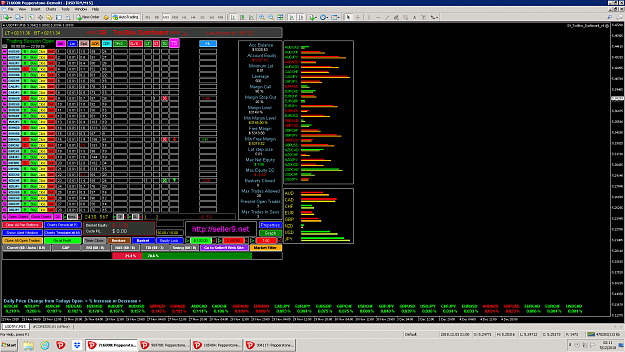
Here is the power of the Market Filter.
I had a long CORE5 basket open but only the X_USD pairs were in the direction of the trade, with the X_JPY pairs being down for the day.
The interesting thing is that if you look closely, the yellow trade line actually looks like it is a losing trade, which it would have been if it had also taken the JPY pairs.
Food for thought.......
Question regarding setting SL on S9 Basket Trader TS v4. With no trade on I can set the Long and Short TP's and SL's. Or I can also delete one side if I only want to take a long or short. However I cannot get the SL to change to a TSL and turn orange and stay orange. Do I have to have a trade already on before the TSL can be set?
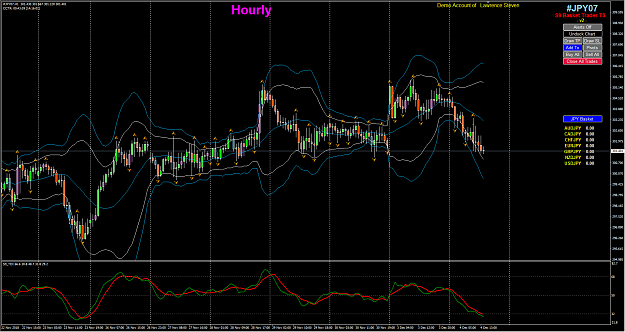
{quote} Looks a good call, both EURUSD and the EUR basket are in a nice OB situation on the TDI. BTW for new traders to TDI, if you have TDI on your chart you don't really need RSI as well because the green line is basically the same as RSI(13) with a bit of smoothing (just sma(2)). Also recently I've started adding another of my favorite indicator Tools, Bollinger Bands stddev(2,white) and stddev(3,blue) to help with my analysis of the chart, for example EUR basket: {image} Notice the price was outside the BB(3,blue) for a few hours, before moving...
Ignored
This setup on EUR basket failed after a brief touch of the Long BO line, price went short again to hit SL with $72 loss, but at least the new TS SL setup worked to prevent a catastrophe.
Some other results today were mixed:
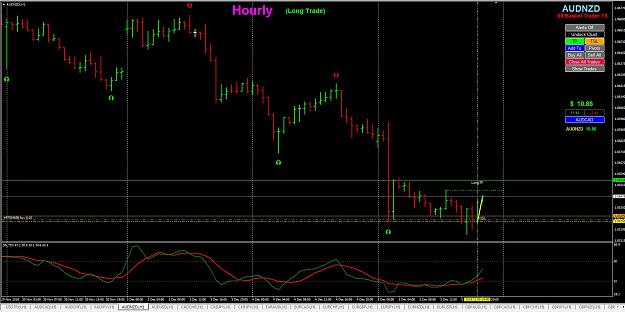
GBP Basket with HAS BO picked up the short, before reversal, just falling short of my 250 target before reversing.
Attached Image (click to enlarge)
Attached Image (click to enlarge)
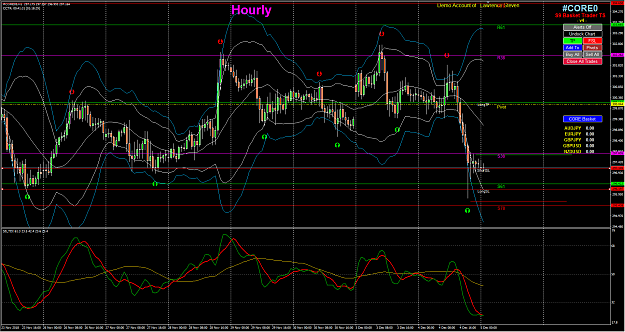
CORE5 Basket with Basket TS, break even
Attached Image (click to enlarge)
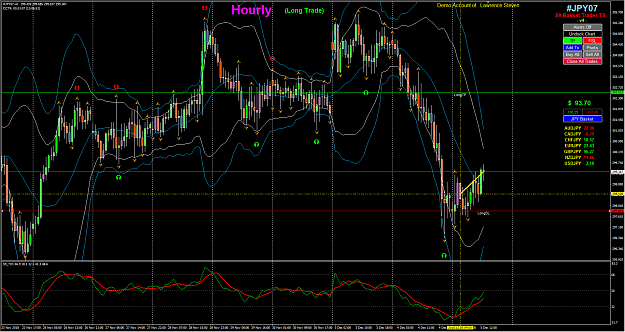
JPY Basket with Basket TS, SL taken out at 50, despite correct short direction taken, this is one of the compromises with using a trailing SL, it does prevents major DrawDowns at the cost of missing some potential profit.
Attached Image (click to enlarge)
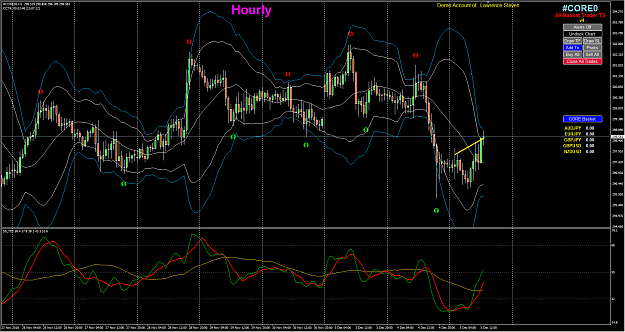
HAS60 BO+1440HM, changed from DM60 because of insufficient trades, small profit taken.
Attached Image (click to enlarge)
These sample charts on Basket TS do not show trades taken, so next time I will try to take before and after shots so you can see where I put my BO lines, and explain my reasons.
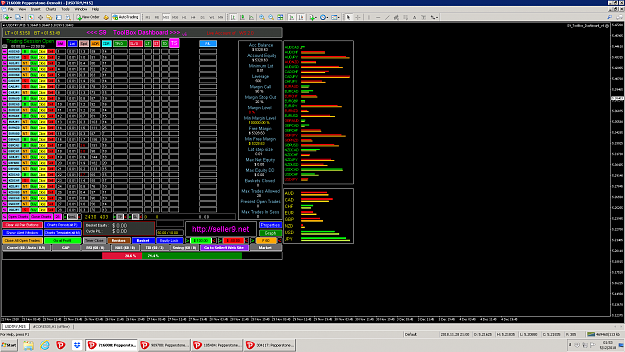
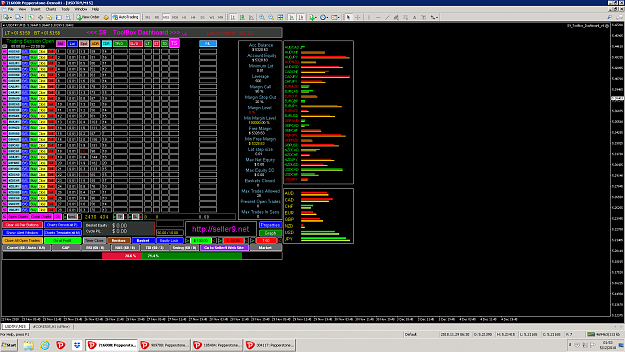
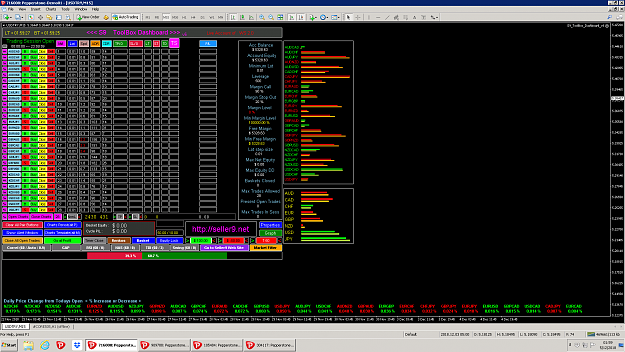
Does the HM still take trades in the latest version of the Dashboard?
I can't seem to get it to do so.
It will filter just fine but when I activate the Trade mode the buy / sell filter disappears and it will not take any trades.
If I activate the Market button the filter returns but still not taking trades.
Has something changed that I haven't paid attention to?
Attached Image (click to enlarge)
Attached Image (click to enlarge)
Attached Image (click to enlarge)
EDIT:- How good am I going this week????
It seems to have sorted itself out and now taking trades - perhaps I was just too impatient.
Should have taken the week off...........
Hi Eugene, Does the HM still take trades in the latest version of the Dashboard? I can't seem to get it to do so. It will filter just fine but when I activate the Trade mode the buy / sell filter disappears and it will not take any trades. If I activate the Market button the filter returns but still not taking trades. Has something changed that I haven't paid attention to? {image} {image} {image} EDIT:- How good am I going this week???? It seems to have sorted itself out and now taking trades - perhaps I was just too impatient....
Ignored
It's more selective when taking trades, just give it time, it's looking for the best point to enter at.
{quote} It's more selective when taking trades, just give it time, it's looking for the best point to enter at.
Ignored
Hello Gene couple of questions for you:
1) Could Pivots be segregated from S9 Basket Trader TS and applied as a generic S9 indicator to any TS including the HAS TS in a future release? I appreciate there are other means of achieving the pivot lines however ideally would like to use standard S9 functionality if possible.
2) Would it also be possible to enable the BO lines of HAS TS to be movable by traders in a future release? Again appreciate HAS has its standard methodology for drawing the BO lines but could be helpful to move the lines subject to to different MA or settings.
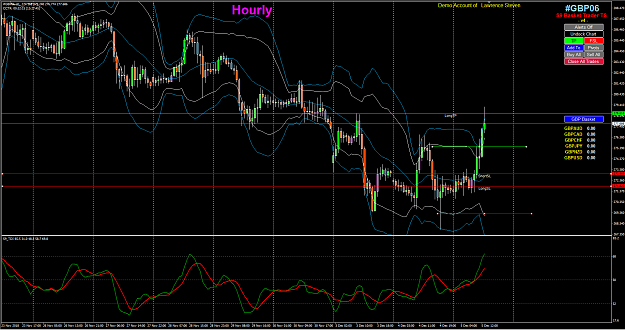
Here is a trade I missed because of DB setup error (had session closed), GBP basket break BB channel: {image}
Ignored
Thanks for posting your results JustUncleL, was this trade automated i.e. did you "Fire and Forget" and if so how did you do auotmate or was this a manual trade?
Also how did you decide on your breakout line positions?
Thanks Gene I assume this trade was based on TDI selection from the DB.
Unfortunately I'm not making much progress with Basket Trader as yet, possibly due to my trading experience. This latest TS does seem to rely on subjective analysis for drawing BO lines etc. I now feel the need to tap into the mindset of more experienced traders than myself in order to make some headway. Any thoughts or guidance most welcome.
{quote} Thanks for posting your results JustUncleL, was this trade automated i.e. did you "Fire and Forget" and if so how did you do auotmate or was this a manual trade? Also how did you decide on your breakout line positions? Many thanks.
Ignored
The GBP basket trade was set up manually to fire on BO of the channel that was based on the Bollinger bands (2). However, I made a Dashboard setup error that prevented the trade from starting, by the time I realised my error it was too late to start it manually.
However, I was able to start my EUR basket based on the same type of BB channel setup, which I have just manually stopped. (I like to stop all my trades before end of day, and start fresh setups on the Asian open).
{quote} Thanks Gene I assume this trade was based on TDI selection from the DB. Unfortunately I'm not making much progress with Basket Trader as yet, possibly due to my trading experience. This latest TS does seem to rely on subjective analysis for drawing BO lines etc. I now feel the need to tap into the mindset of more experienced traders than myself in order to make some headway. Any thoughts or guidance most welcome. Thanks
Ignored
The placing of the TP and SL lines are always very subjective, even using support, resistance, supply, demand, pivots, fibs and etc.
Subjectivity is one thing I am unable to code into a TS, whats between the ears comes into play for that last 5% of the trade, and then things don't do what they were expected to do anyway, this is a crazy market.
I am playing with using the TDI as a auto entry signal to see if can be used as an entry without having to set up the BO lines, the previous post chart was an auto TDI entry with Auto TSL set at 1.5 times ATR and Auto TP set at 3 times ATR, these kick in when the trade opens if selected. I have it running on all 28 single pairs to see what it can do, it will also work on a basket.
This would be part of the Basket Trader and would give you another choice as to how you want to play you entry, either TDI or BO lines, will see if it has any merit or not.
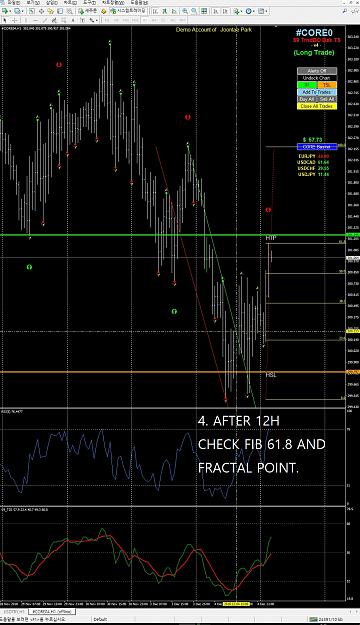
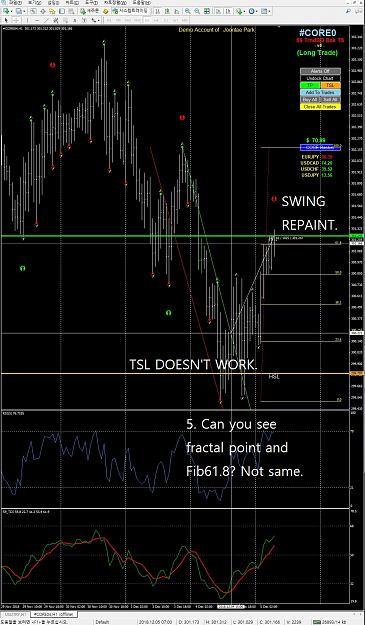
I may also try the swing points as an add on, of course as you know it does re-paint quite a bit. In the past I have used it as an entry and if the swing point repainted I would just add to the trade in the same direction as the original entry. It had some big pip gains as the trade would finally come back in the right direction and started going past the added trades, just need to keep your lot size small or have a big account. LOL
{quote} Thanks Gene I assume this trade was based on TDI selection from the DB. Unfortunately I'm not making much progress with Basket Trader as yet, possibly due to my trading experience. This latest TS does seem to rely on subjective analysis for drawing BO lines etc. I now feel the need to tap into the mindset of more experienced traders than myself in order to make some headway. Any thoughts or guidance most welcome. Thanks
Ignored
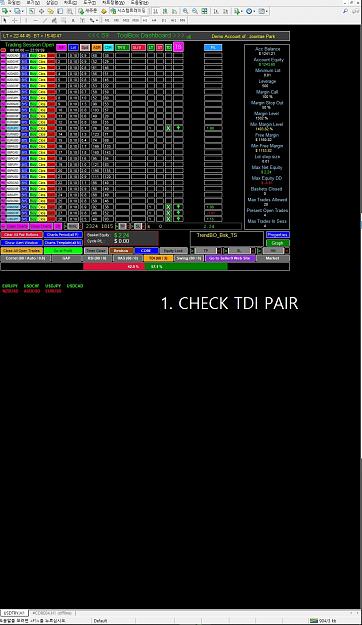
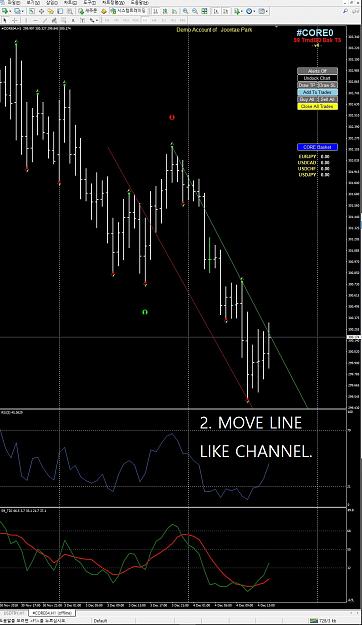
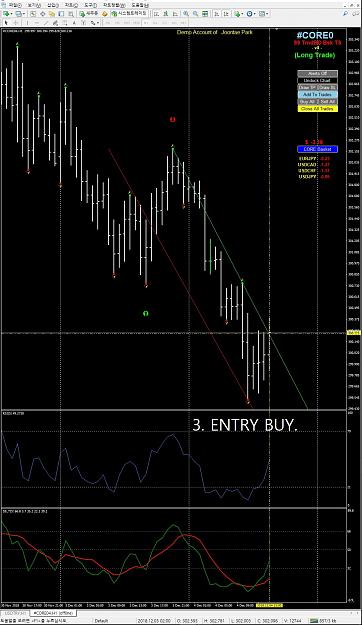
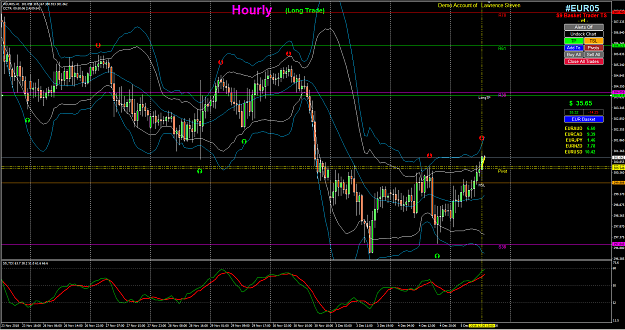
The new TS does not mean you need to use subjective analysis, you need to use just normal analysis ideas and tools. For myself I have been using the combination of TDI and Bollinger Bands, with Pivots used as a supporting tool. So what I do is look for where TDI is at the start of day (Asian start) and then look at what the price action is doing with the Bollinger Bands. There are two main scenario's I'm looking for:
(1) TDI is in OB/OS territory and Price action was on a steep drop or pop and passing outside of BBs. I'm then looking for price to start to move back within the BB and the TDI lines crossing, I then setup BO line above price action to catch an expected reversal: as in this example
Attached Image (click to enlarge)
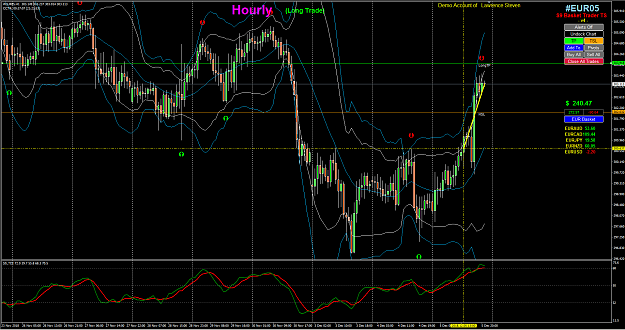
(2) TDI is centralized, Price action is within the BBs and going sideways like a bit of a channel, I then setup BO lines on both sides of the BB(2,white) channel to catch a break going either way. For example:
Attached Image (click to enlarge)
Other traders may have different ways of analyzing the charts, but I hope that helps a bit.
PS: With scenario (2), if the BBs are squeezing closer together this is a more probable trade. Also I agree with Gene regarding where you place your Break lines and TP/SL can be a bit subjective, and also how you analyse a chart will depend on how you can visualize a charts structure and it's price action based on that structure. The market will not always go the way we anticipate, but what we are looking for is highly probable events, so that we have more wins than loses and/or bigger wins with smaller loses.
{quote} The new TS does not mean you need to use subjective analysis, you need to use just normal analysis ideas and tools. For myself I have been using the combination of TDI and Bollinger Bands, with Pivots used as a supporting tool. So what I do is look for where TDI is at the start of day (Asian start) and then look at what the price action is doing with the Bollinger Bands. There are two main senerio's I'm looking for: 1) TDI is in OB/OS territory and Price action was on a steep drop or pop and passing outside of BBs. I'm then looking for price...
Ignored
Thank you JusyUncleL also Gene this is very helpful information, will continue to forge ahead!