I know that these days trading a system which uses moving averages is rather old fashioned, and it’s all supply and demand these days. But this system works for me, and I wanted to share it.
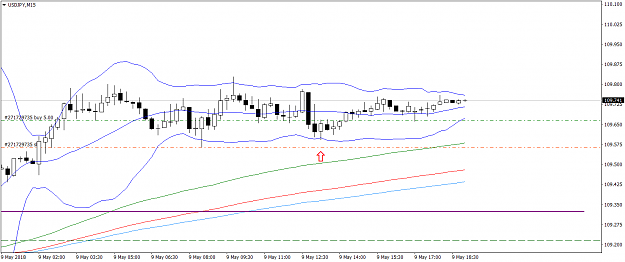
All trades taken off 15M chart.
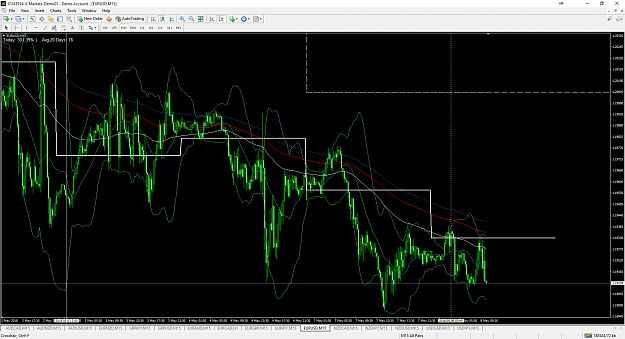
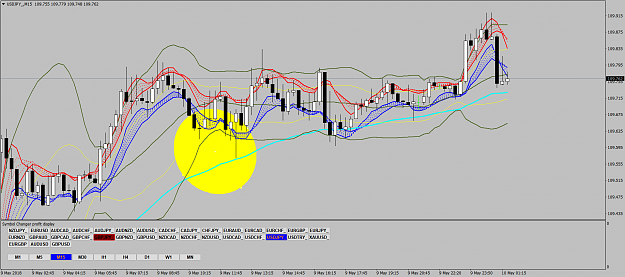
Chart Settings:
· 100 EMA, 160 EMA, 200 EMA
· Bollinger Bands, set to 20 period, 2.5 SD
· Daily and Weekly Pivot points.
The moving averages instantly give me a feel for what stage the market is in – chop, range, beginning of a trend, end of a trend etc. The Bollinger Bands give me my entry triggers. I also use Daily and Weekly pivots.
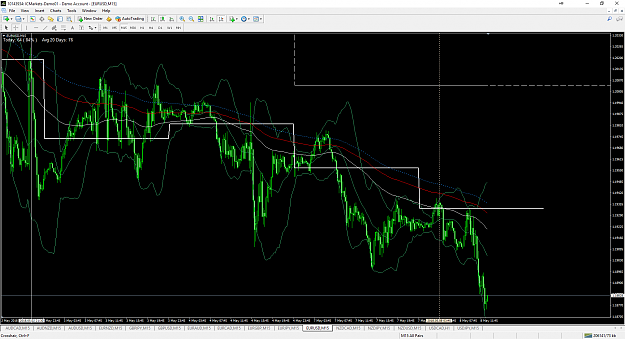
WHAT are we looking for?
The following is WHAT we are looking to see:
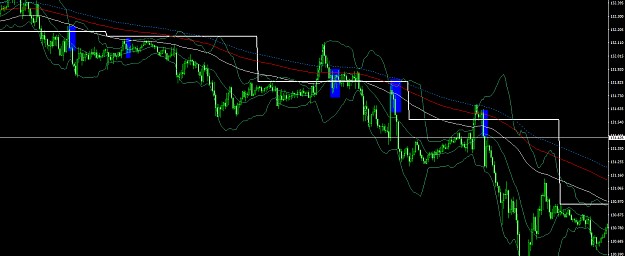
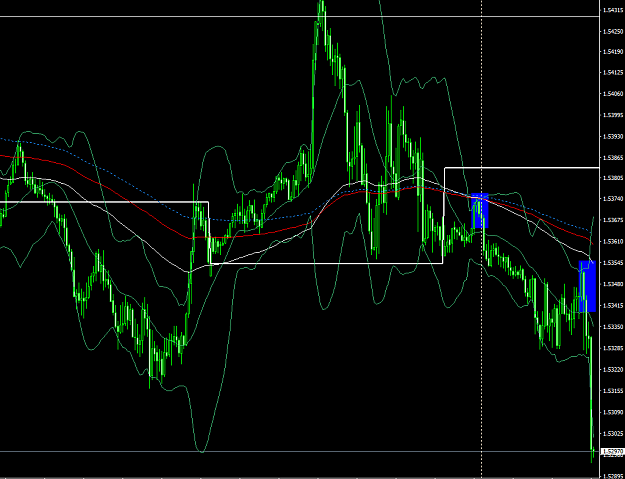
· MAs in sequential order, and all BELOW price for a long, ABOVE for a short.
· DP and WP BELOW price for a long, ABOVE for a short.
· The high or low of the candle wick to close outside the upper Bollinger Band (for a short), but the body to close back inside. Vice versa for a long.
· Wait for the hourly close – to close in the right direction of the trade.
· Enter on open of next candle.
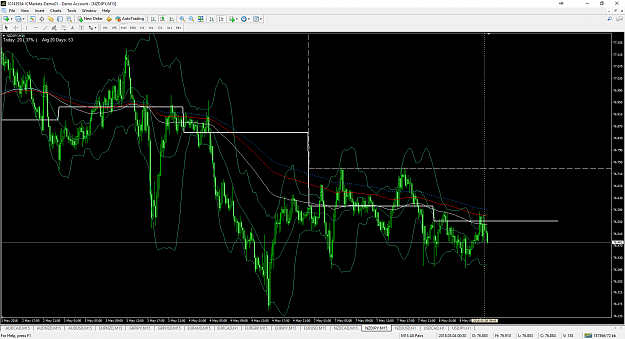
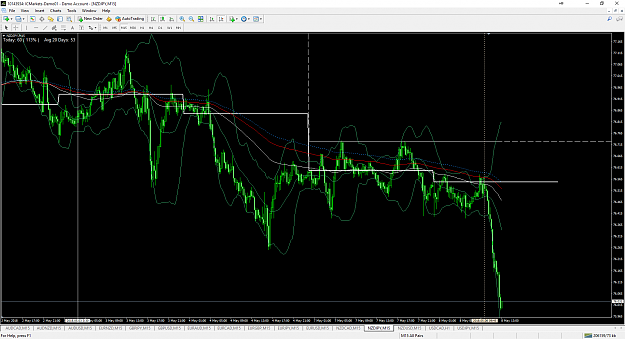
WHERE are we looking to take a trade?
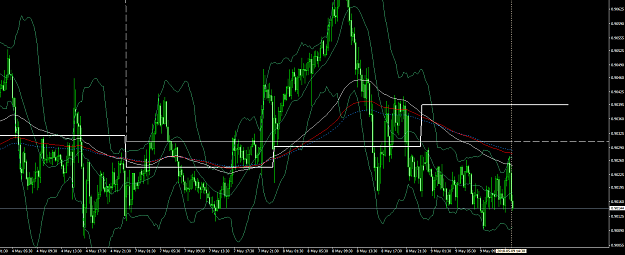
This is not a simple ‘set and forget’ system, where you blindly take every trade set-up. You need to be able to identify when the market is ranging or choppy, and stay out. The ideal set-ups occur when price breaks out of a period of consolidation, and retraces.
Additional Trade Filters:
There are additional filters I use to discount potential trade set ups:
· If price has done more than 100% ATR for the week, no trade in same direction.
· If price has done more than 60% ATR (from point of entry), no trade in same direction.
· More than 120% ATR previous day? No trade the next day.
· 3 up or down days in a row, no trade the next day.
Depending on your risk appetite, you can adopt one or more of these additional filters. Similarly, you may not wish to wait for the hourly close if you get a strong signal. It’s up to you. I find that these filters keep me out of a lot of bad trades, although I will ignore them if I see a really good looking set up.
Stops and Targets
These are up to the individual. I usually use a stop of around 30% ATR, and target around 50% ATR, which gives me around 1.6R. These will be adjusted to take into consideration nearby support/resistance etc. I may also get out on a close above/below the swing high/low, or a close above the 100EMA160EMA. Depends on the trade, and PA at the time.
Frequency of Trades
Because we are looking for a very precise set up, under very specific market conditions, these trades will not occur every day on any given currency pair. Maybe you will get one signal a week, maybe 2, maybe none, depending on the ‘cycle’ of the market that the currency pair is in.
For this reason I track 16 pairs: AUDCAD, AUDNZD, AUDUSD, EURAUD, EURCAD, EURGBP, EURJPY, EURNZD, EURUSD, GBPJPY, GBPUSD, NZDCAD, NZDJPY, NZDUSD, USDCAD, USDJPY. It doesn’t take more than 15 minutes or so to check all pairs at the beginning of every day, and to prepare a watchlist of pairs which may potentially set up.
By monitoring multiple pairs, you can afford to be fussy and take only the best set-ups.
As always with these type of strategies, they work best in trending markets. However, trading off a 15 minute chart, and monitoring multiple pairs, it’s not so hard to find a pair which is in a short term trend or breaking out of consolidation.
Attached is the template I use, and the indicators.
Feel free to ask any questions, clarifications etc.
All trades taken off 15M chart.
Chart Settings:
· 100 EMA, 160 EMA, 200 EMA
· Bollinger Bands, set to 20 period, 2.5 SD
· Daily and Weekly Pivot points.
The moving averages instantly give me a feel for what stage the market is in – chop, range, beginning of a trend, end of a trend etc. The Bollinger Bands give me my entry triggers. I also use Daily and Weekly pivots.
WHAT are we looking for?
The following is WHAT we are looking to see:
· MAs in sequential order, and all BELOW price for a long, ABOVE for a short.
· DP and WP BELOW price for a long, ABOVE for a short.
· The high or low of the candle wick to close outside the upper Bollinger Band (for a short), but the body to close back inside. Vice versa for a long.
· Wait for the hourly close – to close in the right direction of the trade.
· Enter on open of next candle.
WHERE are we looking to take a trade?
This is not a simple ‘set and forget’ system, where you blindly take every trade set-up. You need to be able to identify when the market is ranging or choppy, and stay out. The ideal set-ups occur when price breaks out of a period of consolidation, and retraces.
Additional Trade Filters:
There are additional filters I use to discount potential trade set ups:
· If price has done more than 100% ATR for the week, no trade in same direction.
· If price has done more than 60% ATR (from point of entry), no trade in same direction.
· More than 120% ATR previous day? No trade the next day.
· 3 up or down days in a row, no trade the next day.
Depending on your risk appetite, you can adopt one or more of these additional filters. Similarly, you may not wish to wait for the hourly close if you get a strong signal. It’s up to you. I find that these filters keep me out of a lot of bad trades, although I will ignore them if I see a really good looking set up.
Stops and Targets
These are up to the individual. I usually use a stop of around 30% ATR, and target around 50% ATR, which gives me around 1.6R. These will be adjusted to take into consideration nearby support/resistance etc. I may also get out on a close above/below the swing high/low, or a close above the 100EMA160EMA. Depends on the trade, and PA at the time.
Frequency of Trades
Because we are looking for a very precise set up, under very specific market conditions, these trades will not occur every day on any given currency pair. Maybe you will get one signal a week, maybe 2, maybe none, depending on the ‘cycle’ of the market that the currency pair is in.
For this reason I track 16 pairs: AUDCAD, AUDNZD, AUDUSD, EURAUD, EURCAD, EURGBP, EURJPY, EURNZD, EURUSD, GBPJPY, GBPUSD, NZDCAD, NZDJPY, NZDUSD, USDCAD, USDJPY. It doesn’t take more than 15 minutes or so to check all pairs at the beginning of every day, and to prepare a watchlist of pairs which may potentially set up.
By monitoring multiple pairs, you can afford to be fussy and take only the best set-ups.
As always with these type of strategies, they work best in trending markets. However, trading off a 15 minute chart, and monitoring multiple pairs, it’s not so hard to find a pair which is in a short term trend or breaking out of consolidation.
Attached is the template I use, and the indicators.
Feel free to ask any questions, clarifications etc.
Attached File(s)
Attached File(s)
Attached File(s)