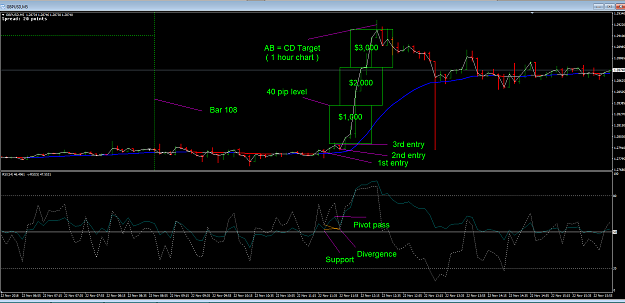
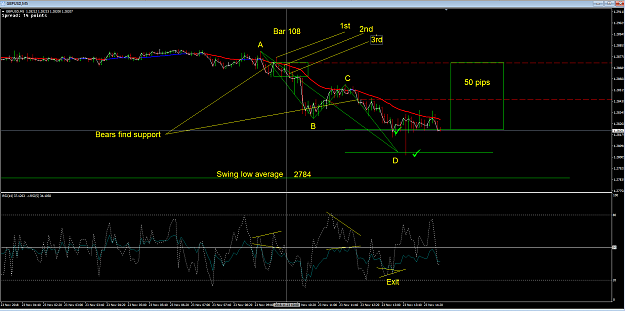
DislikedMust say I'm getting a bit thrown by divergence, as used here. I'm certain that your methods are sound, it's just that chart in #108 has me befuddled. Below is a simple chart of regular and hidden divergence. Identifying the difference used to be confusing until I noticed lines drawn on the tops of price and oscillator forebode of a price fall. Whereas price drawn on bottoms indicate chances improved for a move up. Or, simply put, "Top Down, Bottoms Up". No need to name the beast. {image}Ignored
1