|
Joined May 2007
|
Status: Market Profiler
|73 Posts
Hi Nala66 ,
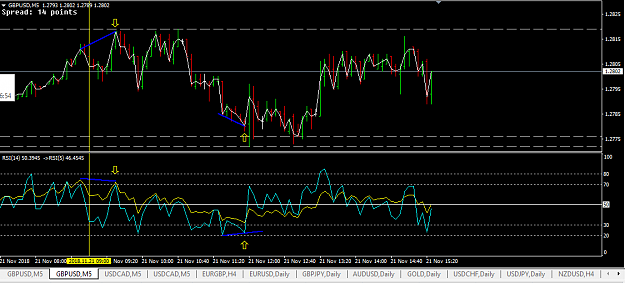
Thanks for the simple system . From the 5 mins , I can see that cable is making HH and HL and bearish divergence forming and price bouncing off the ema and rsi off the 50 mark .
Sorry I changed the colors a bit
Hi Nala66, How do you draw swing highs / lows? What is your criteria to determine which top / bottom will be swing high / low? And which time frame do you use to draw swing high / low? It is easy to find divergences on RSI, but I believe drawing swing highs / lows would be tricky if you do not have a defined method. Regards, Blackeagle
Ignored
God, why these questions? Everything has been told and explained, go back to post1 and read again .....
I see you draw your support and resistance lines on your 5 min chart by using the swing tops and bottoms of the 26 EMA. Does it matter what time frame you use as if you use a different time frame the S & R lines change as the 26 EMA tops and bottoms are typically in a different position.
Hi Nala66, How do you draw swing highs / lows? What is your criteria to determine which top / bottom will be swing high / low? And which time frame do you use to draw swing high / low? It is easy to find divergences on RSI, but I believe drawing swing highs / lows would be tricky if you do not have a defined method. Regards, Blackeagle
Ignored
I think he draw the high and low based on MA that has not broken. And of course it can be drawn after it is formed not before.
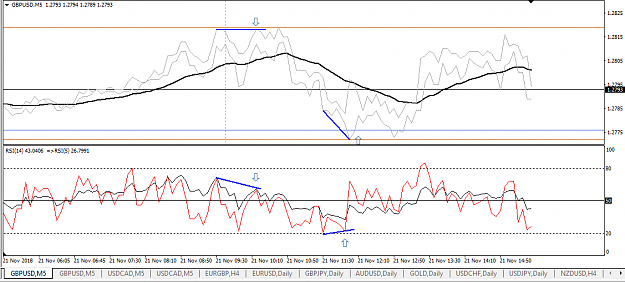
Thanks Alan, busy reading through a few times to grasp the concept. Would you consider this a valid 2 bar test trade although it is a late entry I still took it because it hadn't moved too far yet? or is the fast RSI valley criteria not sufficient? {image}
Ignored
Not really.. It looks like you are testing more than 2 bars. A two bar test would have gotten you in much lower and the stop would be much closer to your entry.
Note there was a further couple of tests you could have made for additional entries above this one.
The valley entry is the indication to look at the lower time frame for the entry and you would then find you can get in earlier still with an even tighter stop.
GM! When looking at Cable at this moment. 3x divergences has formed in last 2.5hrs om M5. Price ranging in about 25pips. Are the signs there for a downward move once it can break 1.2800? Round number? Only if you have time!
Ignored
I don't try to predict the future... That is the point, only trade the reality of the situation. There are only 3 possibilities London will take, up, down or sideways.
These divergences can get us in or out or even hedge trades.
Round numbers mean nothing to me.
The signs are in the question 'Are we trading above or below the average, if below we look to short the tops, if above we look to long the bottoms'
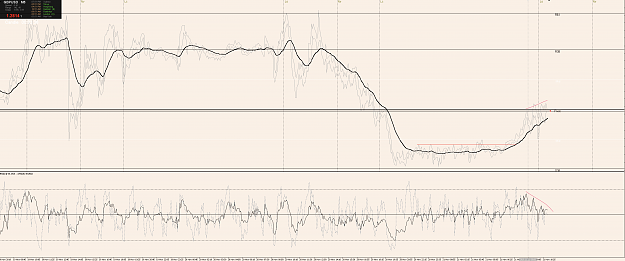
Nala, I've marked the swing highs/lows for today, if you don't mind commenting on it if it's missing anything, and how far would you go on the M5 to spot your swing H/L if for example we didn't have the last two swing lows on Nov 15th ? Thank you. {image}
Ignored
As far back as you can and this is a good question.
The market has a longer memory than our charts have history for so it is not a bad idea to keep a logbook of the levels that are getting old. In this way you can simply drop a line on the chart when price is in the area.
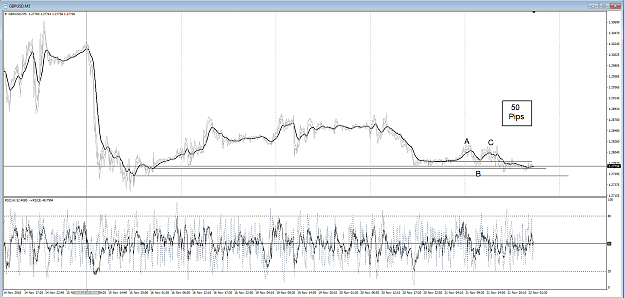
Hi Nala66 , Thanks for the simple system . From the 5 mins , I can see that cable is making HH and HL and bearish divergence forming and price bouncing off the ema and rsi off the 50 mark . Sorry I changed the colors a bit {image}
Ignored
Cool.. See how the market moved south from the bearish divergence at approximately the time we begin trading. Remember the divergence is going to take price back across the EMA . Then another divergence at the bottom again took price back up across the EMA. So on this particular if we haven't got our 50 pips on the first trade then we could have taken another trade long to make up the difference.
See the chart below and all three, A, B and C are all divergences.
At C the average fails to make the HH so it tests the opposite and makes the LL easily
Hi Nala66, How do you draw swing highs / lows? What is your criteria to determine which top / bottom will be swing high / low? And which time frame do you use to draw swing high / low? It is easy to find divergences on RSI, but I believe drawing swing highs / lows would be tricky if you do not have a defined method. Regards, Blackeagle
Ignored
From the onset I told you price is always trying to break the average swing highs and swing lows so draw you line at these levels.
I see you draw your support and resistance lines on your 5 min chart by using the swing tops and bottoms of the 26 EMA. Does it matter what time frame you use as if you use a different time frame the S & R lines change as the 26 EMA tops and bottoms are typically in a different position.
Ignored
You are very correct they are at different positions and if you use say the daily you will have a long white beard waiting for the highs and lows of the averages to be broken.
So if we get in on a trade at the say 5 min level we may hold it for the domino effect of seeing a greater target on a higher time from until we get our target. If we see a problem on the 5 min chart we may just hedge to protect our profit. If it completely turns around then what was once a long may turn into a short.
{quote} God, why these questions? Everything has been told and explained, go back to post1 and read again .....
Ignored
Don't worry about it Eve55, some people like to know the ins and outs of a ducks bum before they can call it a duck. I would sooner everyone gets a good idea of the processes now rather than next week when we start trading.
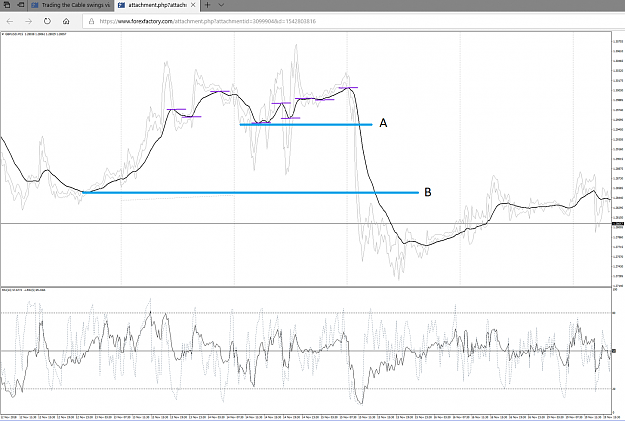
Same chart, different swings. Can you say one is more correct than the other? Check the zigzag indi which is used to determine swing highs / lows. When you you change the parameters, swings change. So this is no different. To be on the same page with Nala66, it is good to know how he determines tops and bottoms. Regards, Blackeagle {image} {image}
Ignored
Using your chart here..(15min)
When price breaks A it is dragging the average to make the LL. To make the average break the lower low price pulls down to B (the next average level) In this case price passes through B so it is trying to drag the average below B also and price will make the next lower level (not shown)
Now at the 5 min level this mostly happens much sooner so you can get in earlier for the domino effect of stepping up through the time of the charts. If you look at the 1 hour chart of this move price probably stopped on that charts time frame of an average swing.
So we use all the time frames and that is why I only trade one pair. If you have the charts side by side like I have you can see clearly what is happening.
It is not possible to draw the swings differently, a swing is a swing is a swing.