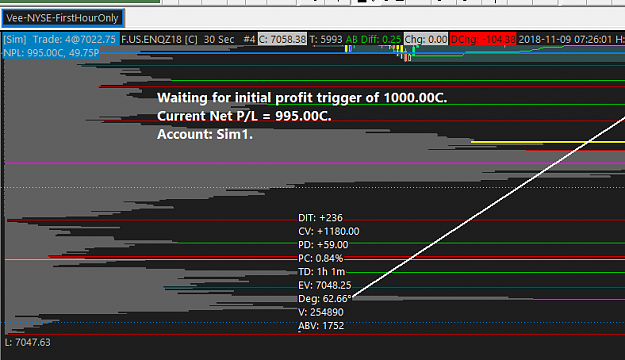
still on sim consistently hitting 100 plus ticks per day for past 2 weeks except yesterday -6 ticks. {image}
Ignored
Time to go live brother :- I am also able to make it but my curiosity to check "what else is out there" is making me play around after my goal is hit. which is my flaw to keep on understanding shit that I should not be caring about :-(
{quote} Time to go live brother :- I am also able to make it but my curiosity to check "what else is out there" is making me play around after my goal is hit. which is my flaw to keep on understanding shit that I should not be caring about :-( {image}
Ignored
True that VEE.
I am too busy with my regular job, i cannot spend much time for trading which is good for me as i am hitting my target within a hour and walkaway , forced to be disciplined now.
not a good day for me 1 loss a bunch of +2s -256 dollars
Ignored
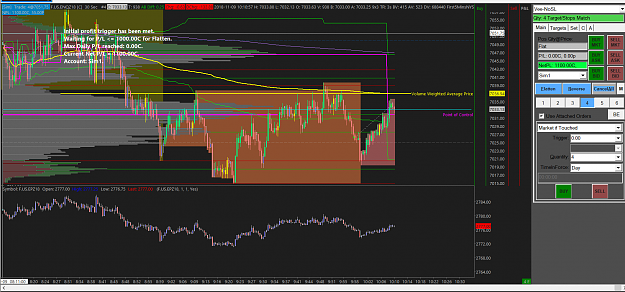
Quite the opposite for me today :- I lost a few good trades because global profit mgmt kept on flatten my trades @ $500 target and I could not figure out what the heck was going on lol
Ended at -15 ... slipped with a railway bar again ... pesky things ... did not see good setups in general today ...
I do not know where you get all your +2s, Mr D ... would appreciate any comments in general ... I learned a lot from the comments that you and Cap made the other day.
Ended at -15 ... slipped with a railway bar again ... pesky things ... did not see good setups in general today ... I do not know where you get all your +2s, Mr D ... would appreciate any comments in general ... I learned a lot from the comments that you and Cap made the other day. {image}
Ignored
Not sure how H traded it today. These are my thoughts, for what it's worth. Harold, please correct or add to, as you see fit. I didn't see the first trade as a pullback worth taking. Subjective I suppose, because it met all the definition points, including having a thrust bar. Sometimes you will have a loss. The second trade should not have been taken however. That is not subjective. You have one leg from the bottom, it pulls back (resting on top of your MA) then goes back up but fails to create a HH. Third trade was probably a valid loss based on Harold's method, except that you have 1 candle coming into you which would have caused H to cancel (it shows momentum). So you could make the argument that the same rules would have saved you from a loss there. You missed a good 2B trade to go long around 7074.00 at 10:05.
Lord, Liar, Lunatic. Those are only 3 options to Christ's diety claim.
{quote} True that VEE. I am too busy with my regular job, i cannot spend much time for trading which is good for me as i am hitting my target within a hour and walkaway , forced to be disciplined now.
Ignored
Decision: I have moved my accounting in points and not ticks. I noticed Tick counting is giving me anxiety and $20/point is easier mental math for my pea sized brain. Minimum scalp or move to BE has to be 1+ Point.As we (eventually) move up the ladder in position size, Point will also help with psychology imo.
Note to Self: I routinely curse about my job when it interferes with my trading activity but let's not forget.... I need a constant paycheck to feed my loved ones and not jeopardize their future. Until income from trading overtakes paycheck income, let's trade responsibly and don't work and trade at the same time (similar to "don't drink and drive" :-) Let's remain grounded in our goals and desires to achieve success from this beast.
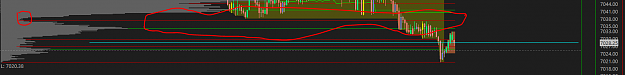
Could someone more savvy in orderflow please explain the fundamentals behind why there should be so less volume at the red line levels i.e. red line in my book as a SR Flip
{quote} I tried the profile indicator on Sierra and these red circled "low volume" price levels are often revisited to "fill the hole". HAve you also noticed this? I am not sure what the technical term is for these red lined zones lol {image}
Ignored
it's called profile pockets. market follows law of thermodynamics (2nd) - where energy moves to achieve equilibrium
in this case price tends to move to low volume areas to achieve "equilibrium" in order for structure to achieve balance
{quote} it's called profile pockets. market follows law of thermodynamics (2nd) - where energy moves to achieve equilibrium in this case price tends to move to low volume areas to achieve "equilibrium" in order for structure to achieve balance
Ignored
Interesting. I would think there would be more trade volumes at those 5 candle reversals creating a flip zone and then after 30+ candles, more traded volume to cause that breakout candle downward move. More orders or trades turns price into directional moves but in this case, it is lack of liquidity on one side of the balance equation? I also fail to understand why price always does not follow volume... per the principles of supply and demand, if more contracts (volume and not trades) are traded at the bid, then price must go down right?
EDIT: Historically, SR Flips have ALWAYS haunted me even in spot fx. I always thought there will be far more volume or liquidity (as there is balance/equilibrium) at these levels to eventually flip the direction one way or the other :-(
{quote} Interesting. I would think there would be more trade volumes at those 5 candle reversals creating a flip zone and then after 30+ candles, more traded volume to cause that breakout candle downward move. More orders or trades turns price into directional moves but in this case, it is lack of liquidity on one side of the balance equation? I also fail to understand why price always does not follow volume... per the principles of supply and demand, if more contracts (volume and not trades) are traded at the bid, then price must go down right?...
Ignored
"more liquidity" at flip zones makes no sense to me. The idea of S/Rs or flip zone as you call it, means that either the few bids or offers dried up at the level causing it to reverse. price moves due to liquidity. that's why at vwap/poc, you have the most volume. more volume just means "value" at that zone, so s/r by defition cannot be value areas...
{quote} "more liquidity" at flip zones makes no sense to me. The idea of S/Rs or flip zone as you call it, means that either the few bids or offers dried up at the level causing it to reverse. price moves due to liquidity. that's why at vwap/poc, you have the most volume. more volume just means "value" at that zone, so s/r by defition cannot be value areas...
Ignored
By "more Liquidity", I mean more imbalance on one side order becoming a HOT hand to flip the direction.... and by that, it should mean "increase in volume at either bid or ask" to result in price making a directional move at these flip zones.
I think I am still missing something basic in my understanding of order flow as I am not able to find a "signature" of correlation between volumes and price.
{quote} By "more Liquidity", I mean more imbalance on one side order becoming a HOT hand to flip the direction.... and by that, it should mean "increase in volume at either bid or ask" to result in price making a directional move at these flip zones. I think I am still missing something basic in my understanding of order flow as I am not able to find a "signature" of correlation between volumes and price.
Ignored
you're too much of a quant for me man. i kind of approach trading very high level. i look for patterns around my indicators and go with that. i don't need to understand why, i just need to know it happens often..
in this case you see s/rs around pockets. ok so then use it as setup. done
{quote} By "more Liquidity", I mean more imbalance on one side order becoming a HOT hand to flip the direction.... and by that, it should mean "increase in volume at either bid or ask" to result in price making a directional move at these flip zones. I think I am still missing something basic in my understanding of order flow as I am not able to find a "signature" of correlation between volumes and price.
Ignored
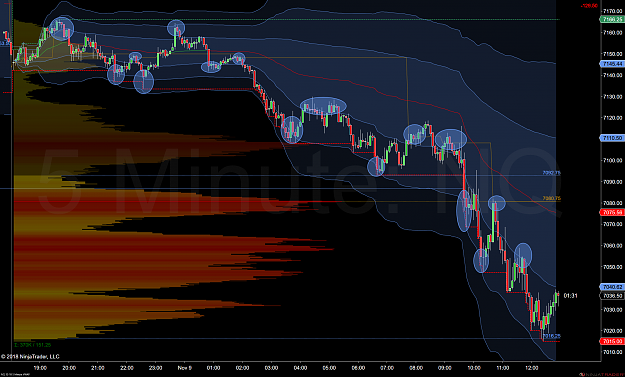
On the picture below, I enabled a feature that shows where the POC was at any given time today (yellow solid line that you see stair stepping down). It's nice to have in order to look back in time and learn how price interacts with POC. Take a look at the blue circles that I added manually. In particular how it interacts with either the POC at that time or with a boundary layer of the VWAP standard deviation bands. As with any support/resistance type of trading you have to take into account how price is reacting at those levels. If it just blows through it blows through. At some point all support and resistance levels will fail, otherwise we would be in a constant range.
Hi, Divergence:
After watching your videos on YouTube I still have a few questions that I hope you can somehow clarify:
1.What exactly are you looking for when trading (is it 123 high & low)?
2.Where exactly are you taking a pullback to?
3.After a pullback what exactly is your entry trigger?
4.Your entry, SL, TP (trade management)?
I’m sorry for so many basic questions as I can’t seem to find answers just by watching videos. And also if you could illustrate with some screenshots (charts) that would be even better because I’m sure others will have the same questions as well. Thank you!
{quote} you're too much of a quant for me man. i kind of approach trading very high level. i look for patterns around my indicators and go with that. i don't need to understand why, i just need to know it happens often.. in this case you see s/rs around pockets. ok so then use it as setup. done
Ignored
WTH... i just made more using the same "pocket" principle lol
{quote} On the picture below, I enabled a feature that shows where the POC was at any given time today (yellow solid line that you see stair stepping down). It's nice to have in order to look back in time and learn how price interacts with POC. Take a look at the blue circles that I added manually. In particular how it interacts with either the POC at that time or with a boundary layer of the VWAP standard deviation bands. As with any support/resistance type of trading you have to take into account how price is reacting at those levels. If it just...
Ignored
fabulous. Thanks man. This makes more logical sense. As a lover of "constants". I like stairsteps better so made my POC also as stairstep :-
Hi, Divergence: After watching your videos on YouTube I still have a few questions that I hope you can somehow clarify: 1.What exactly are you looking for when trading (is it 123 high & low)? 2.Where exactly are you taking a pullback to? 3.After a pullback what exactly is your entry trigger? 4.Your entry, SL, TP (trade management)? I’m sorry for so many basic questions as I can’t seem to find answers just by watching videos. And also if you could illustrate with some screenshots (charts) that would be even better because I’m sure others will have...
Ignored
#1 and 2 WITH 123S i wait for point to be taken out and tale pullback to point 3 #3 if bar is big i come down from point 3 12 ticks for entry #4 stop 12 target 25


![Click to Enlarge
Name: NQZ8 [CV] 30 Sec #3 2018-11-09 10_41_25.762.png
Size: 16 KB](/attachment/image/3081977/thumbnail?d=1541778199)