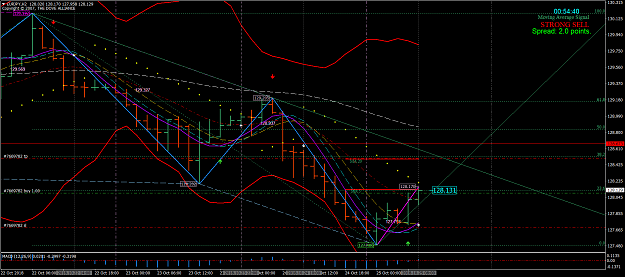
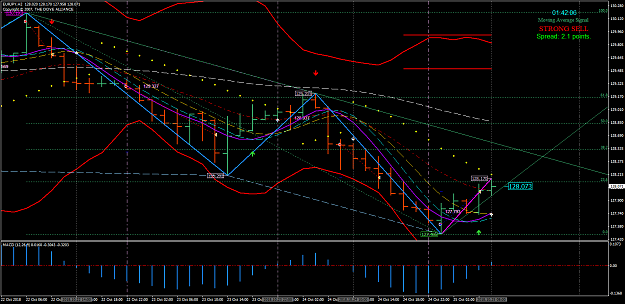
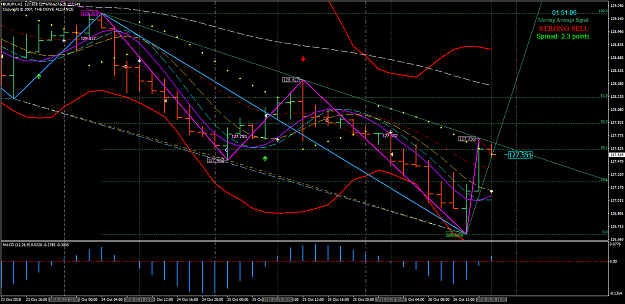
• Home
  • Forums
  • Trades
  • News
  • Calendar
  • Market
  • Brokers
  • Login
  • Join
  • User/Email: Password:
  • 10:41pm
Menu
  • Forums
  • Trades
  • News
  • Calendar
  • Market
  • Brokers
  • Login
  • Join
  • 10:41pm
Sister Sites
  • Metals Mine
  • Energy EXCH
  • Crypto Craft

Options

Bookmark Thread

First Page First Unread Last Page Last Post

Print Thread

Similar Threads

Paradox System: post your entry here 11 replies

Paradox system avg monthly ROR for last 12 months 33 replies

Learning the Paradox System=Set up / Trade Plan / Results Only 1 reply

MTS Vs Random Entry - A Paradox 6 replies

lets talk about the system called PARADOX 2 replies

  • Trading Systems
  • /
  • Reply to Thread
  • Subscribe
  • 4,250
Attachments: The Paradox System
Exit Attachments
Tags: The Paradox System
Cancel

The Paradox System

  • Last Post
  •  
  • 1 723724Page 725726727 863
  • 1 Page 725 863
  •  
  • Post #14,481
  • Quote
  • Edited 4:51pm Oct 24, 2018 4:36pm | Edited 4:51pm
  •  Romar
  • | Joined Apr 2018 | Status: Member | 104 Posts
Quoting Romar
Disliked
{quote} Entry: Short, 10:00 open candle. Rule / confluence : I know the entry its sort of out of nowhere, but the H2 Parabolic just flip for the down. The candle opened near H1 PURPLE and right under H2 FIBO 23.6 + DB has not reconnected with SAR yet. {image}
Ignored
Result: +40 TP hit
Self-evalution:
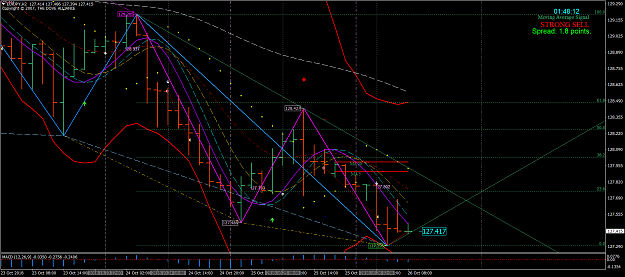
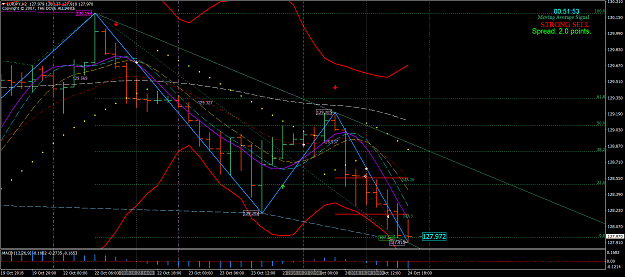
The market is in a downtrend. H1 and H2 was in sync for the downtrend as soon as H2 Parabolic flipped for the down. When SAR connected bottom without DB, I just knew DB had to join SAR because of the downtrend, and also EMA PURPLE crossed for the down on the entry candle. Notice when I made the entry, standard Divergence was not bottom - so the market was not going to retrace toward EMA resistance and come back down to bring out the hidden Divergence yet.
Thank you Master, Paradox for the win!

Attached Image (click to enlarge)
Click to Enlarge

Name: Screenshot1.png
Size: 76 KB
 
3
  • Post #14,482
  • Quote
  • Oct 24, 2018 8:02pm Oct 24, 2018 8:02pm
  •  Contra
  • | Joined Dec 2017 | Status: Member | 51 Posts
Quoting The-Force
Disliked
{quote} We need to be on Demo 106 Being in Canada I also had this problem. I did what our friend ST.WOLF suggested in post 13510 It has been working great for me!
Ignored
Thanks T-Force. Will try that.
 
 
  • Post #14,483
  • Quote
  • Oct 24, 2018 9:48pm Oct 24, 2018 9:48pm
  •  Contra
  • | Joined Dec 2017 | Status: Member | 51 Posts
Quoting The-Force
Disliked
{quote} We need to be on Demo 106 Being in Canada I also had this problem. I did what our friend ST.WOLF suggested in post 13510 It has been working great for me!
Ignored
It worked. I'm on the demo 106 now. I Will wait until we out of this trend and in consolidation to post a plan. I find the trends a little more intimidating.
 
 
  • Post #14,484
  • Quote
  • Oct 25, 2018 5:09am Oct 25, 2018 5:09am
  •  Romar
  • | Joined Apr 2018 | Status: Member | 104 Posts
Trading plan: 8:00 candle server time
Red news : EUR

Daily:
ROMAR - Resistance
EMA - Resistance
PSAR - Resistance
FIBO - UP
Notes:
Everything pointing for a downtrend. Notice Daily imbalance of +100 pip from OPEN to PURPLE. Green price tag also bottom.

4 HR:
ROMAR - Resistance
EMA - Resistance
PSAR - Resistance
FIBO - UP
Notes:
DB/SAR attach bot with green price tag. Everything is pointing down for a downtrend.

2 HR:
ROMAR - Resistance
EMA - Resistance
PSAR - Resistance
FIBO - UP
Notes:
SMOOTH PURPLE cross, DB is attach bot with green price tag and right now SAR detach itself from DB to go top.

1 HR:
ROMAR - Resistance
EMA - Resistance/Support
PSAR - Support
Fibo - UP
Notes:
EMA PURPLE just crossed for up, upper BB is in FIBO.

Final Notes for all four charts:
Currently in downtrend consolidation. On H2 SAR attach top near Parabolic at 23.6 FIBO, also notice Daily market is imbalance by +100.

Entry: Long
Rule / Confluence:
The market looks like it wants to balance itself, because H1 EMA PURPLE cross to target ROMAR/UPPER BB, and H2 SMOOTH PURPLE cross for ups + Green Price tag bot with FIBO 0 on every chart. I know this could be silly because Master stated many time to never trade against the trend... but if I remember correctly I read something about trading against the trend because the market wants to re-balance itself. ( I could be wrong don't take my word for it )

Attached Image (click to enlarge)
Click to Enlarge

Name: Screenshot2.png
Size: 81 KB
 
 
  • Post #14,485
  • Quote
  • Oct 25, 2018 7:57am Oct 25, 2018 7:57am
  •  Romar
  • | Joined Apr 2018 | Status: Member | 104 Posts
Quoting Romar
Disliked
Trading plan: 8:00 candle server time Red news : EUR Daily: ROMAR - Resistance EMA - Resistance PSAR - Resistance FIBO - UP Notes: Everything pointing for a downtrend. Notice Daily imbalance of +100 pip from OPEN to PURPLE. Green price tag also bottom. 4 HR: ROMAR - Resistance EMA - Resistance PSAR - Resistance FIBO - UP Notes: DB/SAR attach bot with green price tag. Everything is pointing down for a downtrend. 2 HR: ROMAR - Resistance EMA - Resistance PSAR - Resistance FIBO - UP Notes: SMOOTH PURPLE cross, DB is attach bot with green price tag...
Ignored
Result : got a few + pips, but that was not the goal.
Self-evaluation:
Close the trade 5 minutes before the news. In this trade I was looking for the market to re-balance with the Daily PURPLE, and the when I entered the market barely moved. I believe the right entry was on the 6:00 candle - we had WHITE PURPLE cross for the consolidation, the candle opened above/at SMOOTH, every chart had the green price tag bottom + Daily imbalance 100 pips.
Overall bad trade... I was probably late to the re-balancing move back up, or going long was never an option. I am not sure, can Master or any Elite comment on this scenario please?

Attached Image (click to enlarge)
Click to Enlarge

Name: Screenshot1.png
Size: 80 KB
 
 
  • Post #14,486
  • Quote
  • Oct 25, 2018 10:05am Oct 25, 2018 10:05am
  •  killerxover
  • | Joined Feb 2010 | Status: Member | 81 Posts
Date: 25 October 2018 8.30 PM GMT+7

News Releases:

Daily:
ROMAR Resistance
EMA Resistance
PSAR Resistance

Check List:
Last MACD 0 crossing - Down
Last EMA Alert Arrow - Down
Last DB Attachment - Bottom 127.486
Last SAR Attachment - Bottom 127.486
Fibo - Up
Notes: Daily is Downtrend. 4 Horsemen down. Light blue and Gold divergences attached at DB/SAR


4 HR:
ROMAR Resistance
EMA Resistance
PSAR Resistance

Check List:
Last DB Attachment - Bottom 127.486
Last SAR Attachment - Top 128.427
Fibo - Up
Notes: Market in downtrend. 4Horsemen down. White begins crossing purple. EMA Uptrend.


2 HR:
ROMAR Resistance
EMA Resistance
PSAR Support

Check List:
Last MACD 0 crossing - Up
Last EMA Alert Arrow - Up
Last DB Attachment - Bottom 127.486
Last SAR Attachment - Top 128.427
Fibo - Up
Notes: H2 in consolidation up. Smooth crossed White. EMA has not crossed Purple. PSAR flipped for up. ROMAR is resistance. Last SAR on current candle on Top.


1 HR:
ROMAR Resistance (out of trading zone)
EMA Support
PSAR Support

Check List:
Last MACD 0 crossing - Up
Last EMA Alert Arrow - Up
Fibo - Up
Notes: H1 in consolidation. 4 horsemen up. EMA up. Upper BB is resistance.


Final Notes:
Market in Consolidation up. Daily Down with market imbalance from purple. H4 is down with white is going to cross purple. H1 is consolidating up with Upper BB is resistance. H2 is consolidating up, PSAR flipped for up. 4 horsemen are up. MACD and EMA arrow in correct order. I will make Long entry on next opening candle targeting ROMAR.


Entry:
Open BUY

Attached Image (click to enlarge)
Click to Enlarge

Name: EURJPYH2BUY.png
Size: 63 KB
 
 
  • Post #14,487
  • Quote
  • Oct 25, 2018 10:50am Oct 25, 2018 10:50am
  •  btrfx1
  • Joined Apr 2012 | Status: Member | 270 Posts
Hey Romar,
At the risk of getting in to a trade too early I thought the Candle opening at/above smooth had potential for 40 pips despite other factors at play. e.g. PSAR had not flipped yet, but SAR had anchored so that was a positive for upward movement. I cant see it clear enough from the displayed chart but it looked like the 40 pips made it, before that retracement down


Killerxovers chart and notes show a better entry is developing and also what can happen with that retracement down but we now appear to have a better chance of getting into a long trade.

It's way past bedtime here so good luck with today's trading.

Like you guys am just learning and added my comments, which I hope are correct.

Goodnite
 
 
  • Post #14,488
  • Quote
  • Oct 25, 2018 12:18pm Oct 25, 2018 12:18pm
  •  Romar
  • | Joined Apr 2018 | Status: Member | 104 Posts
Quoting btrfx1
Disliked
Hey Romar, At the risk of getting in to a trade too early I thought the Candle opening at/above smooth had potential for 40 pips despite other factors at play. e.g. PSAR had not flipped yet, but SAR had anchored so that was a positive for upward movement. I cant see it clear enough from the displayed chart but it looked like the 40 pips made it, before that retracement down Killerxovers chart and notes show a better entry is developing and also what can happen with that retracement down but we now appear to have a better chance of getting into a...
Ignored
thank you for the reply!
 
 
  • Post #14,489
  • Quote
  • Oct 25, 2018 11:36pm Oct 25, 2018 11:36pm
  •  killerxover
  • | Joined Feb 2010 | Status: Member | 81 Posts
Quoting killerxover
Disliked
Date: 25 October 2018 8.30 PM GMT+7 News Releases: Daily: ROMAR Resistance EMA Resistance PSAR Resistance Check List: Last MACD 0 crossing - Down Last EMA Alert Arrow - Down Last DB Attachment - Bottom 127.486 Last SAR Attachment - Bottom 127.486 Fibo - Up Notes: Daily is Downtrend. 4 Horsemen down. Light blue and Gold divergences attached at DB/SAR 4 HR: ROMAR Resistance EMA Resistance PSAR Resistance Check List: Last DB Attachment - Bottom 127.486 Last SAR Attachment - Top 128.427 Fibo - Up Notes: Market in downtrend. 4Horsemen down. White begins...
Ignored
Result:
SL hit

Evaluation:
I don't really know where I went wrong. H2 is trend chart and on my entry, market was in consolidating up with PSAR flip for up. 4 horsemen was up. Candle open above Smooth. I thought it would be good to go, but later EMA just slide over smooth and I did't see that coming. All I can say is that big picture was saying H4 and Daily trend were down.
I hope that I could get advice from senior and Dove.
 
 
  • Post #14,490
  • Quote
  • Oct 26, 2018 12:43am Oct 26, 2018 12:43am
  •  btrfx1
  • Joined Apr 2012 | Status: Member | 270 Posts
Hi Romar n Killerxover.
My comments last nite were made from looking at Killerxovers chart---using my small laptop--a no no---anyway today I looked at all 4 charts and offer the following for your review---But I am not Senior nor Dove, so it's objective is to offer each of you some part of the rules laid out for us and comment, to see if we can learn more.

1--! Hr Chart--At 06:00 time--P.W and S had crossed and the Bar closed over the EMA with the appropriate Trend alert--so the next bars open at 07:00 (Price 127.92) seemed a good entry---followed by Smooth crossing EMA about 10:00/11:00, which later closed at 12:00,-- price 128.425 (50 Pip Range)

2--2 Hr Chart--I cant see Sync. happening with 1 Hr---EMA is under Romar--(as is the 1 Hr chart, 4 Hr and Daily) That seems to me to be an important part of observing the big picture Dove talks about--and Killerxover saw that.

So was the upmove from 08:00 2 Hr chart a good entry?? according to the rules.
Was the downmove from 22:00 2 Hr chart at 23.6 Fib (app. price 127.85 a good entry?? according to the rules.

The 4Hr and Daily confirm DOWN move---look forward to some comments.
 
 
  • Post #14,491
  • Quote
  • Oct 26, 2018 2:47am Oct 26, 2018 2:47am
  •  Retrogue
  • Joined Feb 2017 | Status: Member | 229 Posts
Quoting killerxover
Disliked
{quote} Result: SL hit Evaluation: I don't really know where I went wrong. H2 is trend chart and on my entry, market was in consolidating up with PSAR flip for up. 4 horsemen was up. Candle open above Smooth. I thought it would be good to go, but later EMA just slide over smooth and I did't see that coming. All I can say is that big picture was saying H4 and Daily trend were down. I hope that I could get advice from senior and Dove.
Ignored
Study the SAR/ Hidden Divergence in what happened yesterday.
Never Give Up
 
1
  • Post #14,492
  • Quote
  • Edited 4:21am Oct 26, 2018 3:54am | Edited 4:21am
  •  SuchParadox
  • Joined Feb 2018 | Status: Member | 289 Posts
Quoting killerxover
Disliked
{quote} Result: SL hit Evaluation: I don't really know where I went wrong. H2 is trend chart and on my entry, market was in consolidating up with PSAR flip for up. 4 horsemen was up. Candle open above Smooth. I thought it would be good to go, but later EMA just slide over smooth and I did't see that coming. All I can say is that big picture was saying H4 and Daily trend were down. I hope that I could get advice from senior and Dove.
Ignored
The h4 ema had the power with the sar connection bellow psar and you will see clues of the continuation down on the h4 with purple barely able to cross smooth and in this situation, even though purple was to cross ema on h2, you should have been mindful of an ema slider situation with the h4 and h1 chart confirming, the underlying trend was still down.

Just my two pence
 
1
  • Post #14,493
  • Quote
  • Oct 26, 2018 4:13am Oct 26, 2018 4:13am
  •  Romar
  • | Joined Apr 2018 | Status: Member | 104 Posts
Trading plan: 8:00 candle server time
Red news : EUR

Daily:
ROMAR - Resistance
EMA - Resistance
PSAR - Resistance
FIBO - UP
Notes:
Everything pointing for a downtrend. Notice Daily imbalance, and DB/SAR is bot with FIBO 0.

4 HR:
ROMAR - Resistance
EMA - Resistance
PSAR - Resistance
FIBO - UP
Notes:
DB/SAR attach bot with green price tag. Everything is pointing down for a downtrend, with a small imbalance.

2 HR:
ROMAR - Resistance
EMA - Resistance
PSAR - Resistance
FIBO - UP
Notes:
Everything pointing down, DB/SAR bot with FIBO 0.

1 HR:
ROMAR - Resistance
EMA - Resistance
PSAR - Resistance
Fibo - UP
Notes:
Everything pointing down for downtrend.

Final Notes for all four charts:
Currently in downtrend. Every chart has FIBO GREEN UP.

Projected Entry:
Short: Let's keep things simple, straight to the point of what the Paradox is indicating, and let's not overthink this moment like I did yesterday. The Paradox is in a full blown downtrend. Looking to trade off resistance.

Attached Image (click to enlarge)
Click to Enlarge

Name: Screenshot1.png
Size: 83 KB
 
1
  • Post #14,494
  • Quote
  • Oct 26, 2018 4:54am Oct 26, 2018 4:54am
  •  killerxover
  • | Joined Feb 2010 | Status: Member | 81 Posts
Quoting Retrogue
Disliked
{quote} Study the SAR/ Hidden Divergence in what happened yesterday.
Ignored
HI Retrogue, thanks for your advice. I read on Dove's explanation about Divergence at page 203. I think now I know why that the market didn't go up.
Just want to make sure, is it true that hidden divergence was attached at bottom (127.486) with DB/SAR and the gold divergence had not showed yet? And because of gold divergence didn't show, white/smooth crossing purple for up wasn't a signal of reversal but only a retracement back for several candles and then will continue back down to show the gold divergence?
 
 
  • Post #14,495
  • Quote
  • Oct 26, 2018 5:07am Oct 26, 2018 5:07am
  •  killerxover
  • | Joined Feb 2010 | Status: Member | 81 Posts
Quoting SuchParadox
Disliked
{quote} The h4 ema had the power with the sar connection bellow psar and you will see clues of the continuation down on the h4 with purple barely able to cross smooth and in this situation, even though purple was to cross ema on h2, you should have been mindful of an ema slider situation with the h4 and h1 chart confirming, the underlying trend was still down. Just my two pence
Ignored
Hi SuchParadox.
Yes, you are right. I went back and checked about Dove's saying about H4 chart.

Dove
I have been debating this decision for about a week in giving this 4 hour chart. The 4 hour chart is not a trading chart but will replace the Daily as for reference with support and resistance. The H4 is stripped down for reference only. The EMA signal, Arrows, and MACD is not on the H4.
The reason for debating is because some of you, if not all of you, would want to add indicators to the H4 and would be a bad mistake in doing so. If you use the H4 as you would the Daily then you have a great reference with ROMAR, EMA, and the Parabolic's between the H2 and H4; and the H4 could give you a good reference with entry with the H2 as for the DB/SAR being delayed on the H4 comparable with the H2.
My decision was based in helping those that are having difficulties in recognizing sliders. The H4 might be able to help. Another reason is because of the delay on the H4 as for support and resistance and could help you on entries with the delay..
On your trading plan you can add the H4 below the Daily and reference Support and Resistance on the H4 instead of the Daily. The H2 is still your Trading Chart and not the H4.


I think I should have waited at least smooth crosses purple for swing up in H4 as reference for taking entry in H2 chart. Thanks mate.
 
 
  • Post #14,496
  • Quote
  • Oct 26, 2018 2:36pm Oct 26, 2018 2:36pm
  •  Ronin303
  • Joined May 2017 | Status: Member | 186 Posts
Quoting killerxover
Disliked
{quote} Result: SL hit Evaluation: I don't really know where I went wrong. H2 is trend chart and on my entry, market was in consolidating up with PSAR flip for up. 4 horsemen was up. Candle open above Smooth. I thought it would be good to go, but later EMA just slide over smooth and I did't see that coming. All I can say is that big picture was saying H4 and Daily trend were down. I hope that I could get advice from senior and Dove.
Ignored
Open below EMA with the ROMAR trend in such situation is a dangerous thing to happen for not going long there. Rather I would say it was a signal for short if other confluence factors support...
 
 
  • Post #14,497
  • Quote
  • Oct 26, 2018 2:50pm Oct 26, 2018 2:50pm
  •  Ronin303
  • Joined May 2017 | Status: Member | 186 Posts
Well guys... You may have a look on my trades of this week. It was a 5 out of 5 success. I generally couldn't take 5 trades in a week.

Attached Image (click to enlarge)
Click to Enlarge

Name: Result EJ H2 2018-10-22-1200.png
Size: 71 KB


Attached Image (click to enlarge)
Click to Enlarge

Name: Result EJ H2 2018-10-23-0600.png
Size: 74 KB


Attached Image (click to enlarge)
Click to Enlarge

Name: Result EJ H2 2018-10-24-1600.png
Size: 72 KB


Attached Image (click to enlarge)
Click to Enlarge

Name: Result EJ H2 2018-10-25-0600.png
Size: 70 KB


Attached Image (click to enlarge)
Click to Enlarge

Name: Result EJ H2 2018-10-25-2200.png
Size: 77 KB


Well, the last one is not on Friday rather it was taken on Thursday late night. I accidentally saw the setup and took the trade. And I take the Friday off.

One of the trade above is more than 40 pips. Actually it was targeted for 80 pips. Though it reached my target, I closed it manually for some reasons I forget.

Regards,
Ronin

(Note: M.A lines are not correct)
 
10
  • Post #14,498
  • Quote
  • Oct 26, 2018 3:15pm Oct 26, 2018 3:15pm
  •  Romar
  • | Joined Apr 2018 | Status: Member | 104 Posts
Quoting Ronin303
Disliked
Well guys... You may have a look on my trades of this week. It was a 5 out of 5 success. I generally couldn't take 5 trades in a week. {image} {image} {image} {image} {image} Well, the last one is not on Friday rather it was taken on Thursday late night. I accidentally saw the setup and took the trade. And I take the Friday off. One of the trade above is more than 40 pips. Actually it was targeted for 80 pips. Though it reached my target, I closed it manually for some reasons I forget. Regards, Ronin (Note: M.A lines are not correct)
Ignored
Wowww nice trades Ronin!
On the Thursday buy entry trade, could you please show us your trading plan?? (for learning purposes)
 
1
  • Post #14,499
  • Quote
  • Oct 26, 2018 6:49pm Oct 26, 2018 6:49pm
  •  Contra
  • | Joined Dec 2017 | Status: Member | 51 Posts
Quoting Ronin303
Disliked
Well guys... You may have a look on my trades of this week. It was a 5 out of 5 success. I generally couldn't take 5 trades in a week. {image} {image} {image} {image} {image} Well, the last one is not on Friday rather it was taken on Thursday late night. I accidentally saw the setup and took the trade. And I take the Friday off. One of the trade above is more than 40 pips. Actually it was targeted for 80 pips. Though it reached my target, I closed it manually for some reasons I forget. Regards, Ronin (Note: M.A lines are not correct)
Ignored
Thanks for Sharing!
 
 
  • Post #14,500
  • Quote
  • Oct 27, 2018 1:45am Oct 27, 2018 1:45am
  •  TraderMarcos
  • Joined Nov 2016 | Status: Trading in the moment. | 109 Posts
Quoting SuchParadox
Disliked
{quote} The h4 ema had the power with the sar connection bellow psar and you will see clues of the continuation down on the h4 with purple barely able to cross smooth and in this situation, even though purple was to cross ema on h2, you should have been mindful of an ema slider situation with the h4 and h1 chart confirming, the underlying trend was still down. Just my two pence
Ignored

Glad to still see you here such paradox.
To reach that level of determination is a matter of the will.
 
1
  • Trading Systems
  • /
  • The Paradox System
  • Reply to Thread
    • 1 723724Page 725726727 863
    • 1 Page 725 863
2 members viewing:
Bsverma
,
Invisible
  • More
Top of Page
  • Facebook
  • Twitter
About FF
  • Mission
  • Products
  • User Guide
  • Media Kit
  • Blog
  • Contact
FF Products
  • Forums
  • Trades
  • Calendar
  • News
  • Market
  • Brokers
  • Trade Explorer
FF Website
  • Homepage
  • Search
  • Members
  • Report a Bug
Follow FF
  • Facebook
  • Twitter

FF Sister Sites:

  • Metals Mine
  • Energy EXCH
  • Crypto Craft

Forex Factory® is a brand of Fair Economy, Inc.

Terms of Service / ©2023