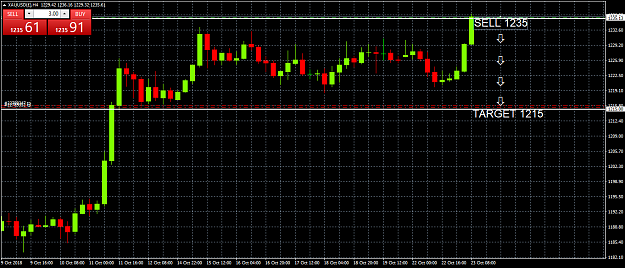
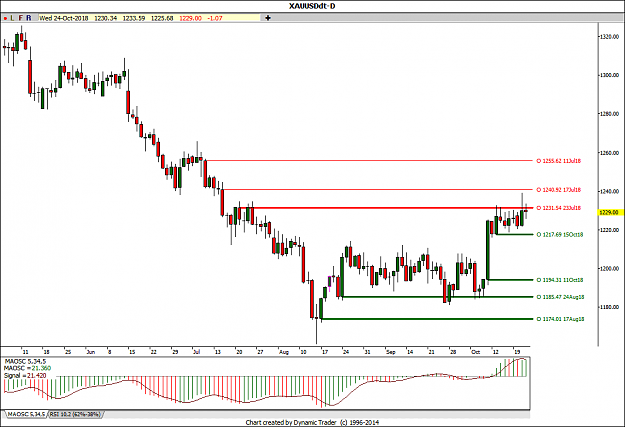
DislikedGold consolidates around the 1222 level and forms what it appears to be a flag or pennant pattern. From the current level, the price of gold may head in any direction even though it is trying to keep its bullish momentum. To the upside, the 200 day EMA around the 1248 level may act as resistance, but the most relevant resistance is at the 1266 level where we can find the 200 week EMA. To the downside, the 1214 level, which was the upper boundary of the previous consolidation, may act as support. {image}Ignored
very simple and to the point analysis.. I am also on it provided something abnormal would not happen inshAllah!
after reaching price somewhere around 1267, gold may retrace downward (price can be suggested after getting the exact level at top) before taking another flight in the month of Dec'18/Jan'19.
P.S. Trade with the discipline of Money Management and Risk Management.