"Ancient" Trading Strategy
Hello World of Traders
This is my first thread in ForexFactory. I will try my best to share and explain to fellow traders about my "Ancient" Trading Strategy. Why "Ancient"?..Because, it only based on pure Price Action plus using few tools such as Fibonacci Retracement & Expansion and trendline...maybe at the later stages,harmonic pattern (only focus on 1 to 1 pattern). After that I will share few SOP / Plan / Techniques..
What I learned by reading lot of threads in here:
1. Eventually some people will ask me to attach TE or post any proof that I trade
profitably from the system.
- I trade profitably using the system,I don't have to proof to YOU as I don't trade using
YOUR MONEY.Just WALK AWAY if you don't trust me.No need for personal attack.
2. Some will ask for EA, indicator and template.
- I don't have any working EA on the system.If you able to code EA based on what I share
please share with me.
3. Few will become guardian angel with the 'intention' to protect newbie.
- I thank to those who have genuine intention to protect newbie. But for those who just
want to show off, please walk away.
4. Few will come and trying to disprove the system and try to proof their system is the best.
- What work for me, not 100% will work for everybody.Depend on your personality, trading
style, daily life, discipline etc...If not suit your style, please walk away.
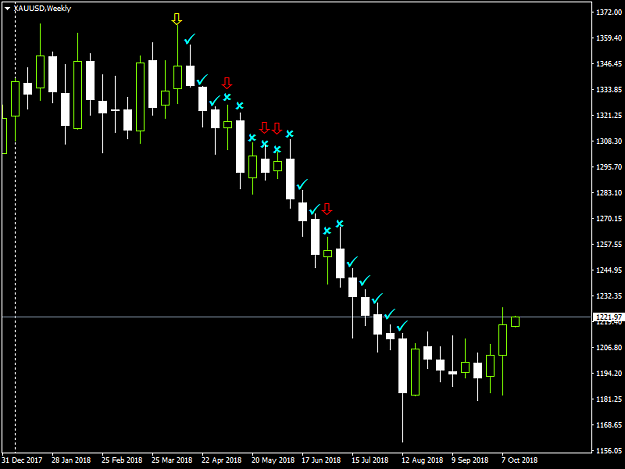
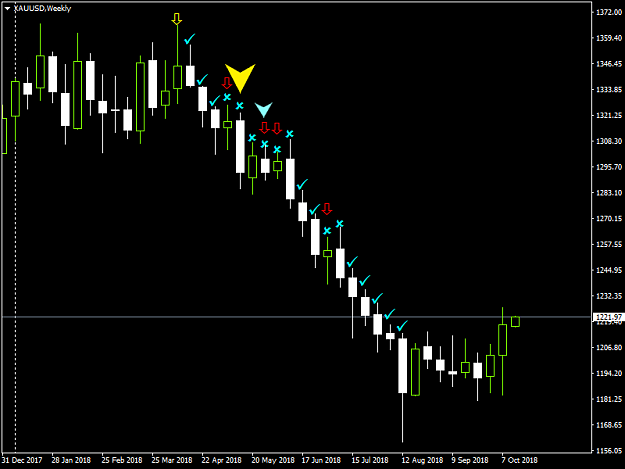
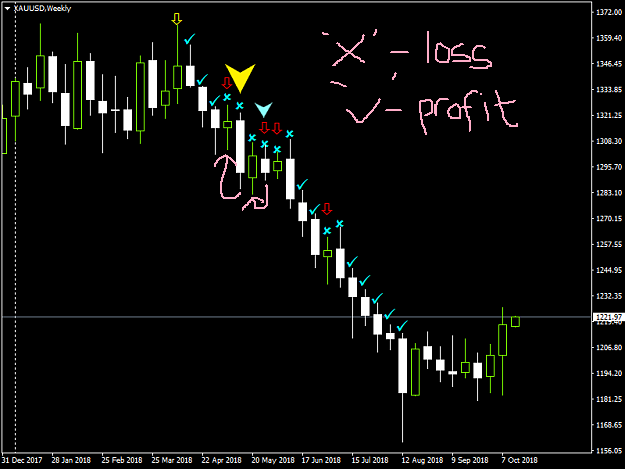
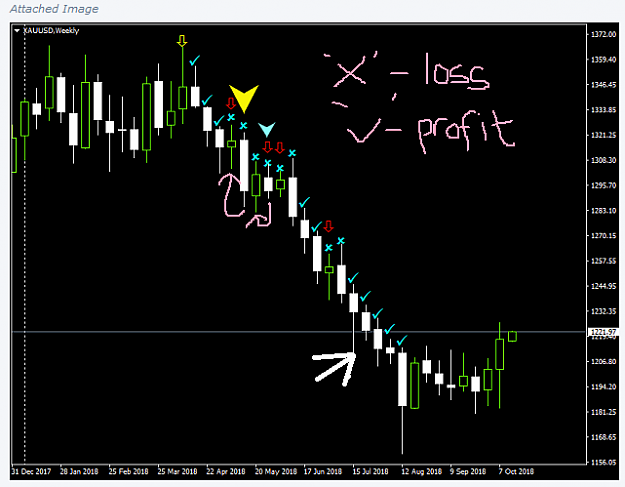
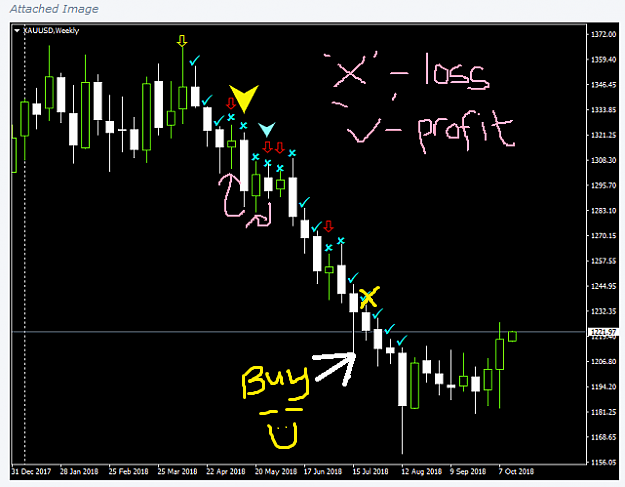
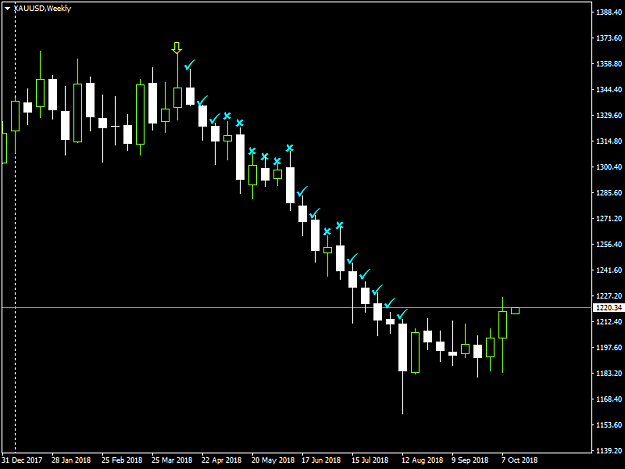
Let we begin with XAUUSD chart below (past price action) .I had marked on that chart with few symbols. Based on that chart, what can we conclude?What trading method can we extract?
Attached Image (click to enlarge)
Close Trade At Profit