You are welcome. Example with 32 instances to max out 100% of my Threadripper 1950X (including HT):
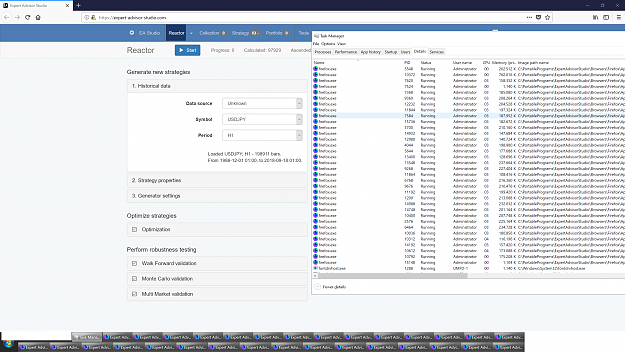
This is using Lawlietfox (custom Firefox build) as it beats all the competition in terms of strategy generating speed in EA Studio (Chrome, Edge, etc.) because its a PGO build and has the best Javascript compiling / running performance in all the tests I´ve done with EA Studio (which are extensive as EA Studio runs 24/7 here, being a full time automated trader):
https://sourceforge.net/projects/law.../Release/61.x/
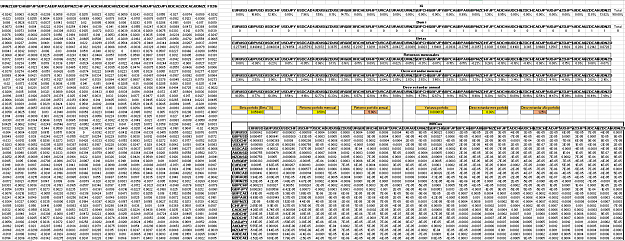
Attached Image (click to enlarge)
This is using Lawlietfox (custom Firefox build) as it beats all the competition in terms of strategy generating speed in EA Studio (Chrome, Edge, etc.) because its a PGO build and has the best Javascript compiling / running performance in all the tests I´ve done with EA Studio (which are extensive as EA Studio runs 24/7 here, being a full time automated trader):
https://sourceforge.net/projects/law.../Release/61.x/
2