Bear or bull trap?
Hello dear traders,
you've heard or read it many times, what is a bull or bear trap? It is supposed to be a trap in which the investor, who expects falling or rising prices, invests on the basis of his analysis and subsequently turns out to be a misjudgment. Are these traps really, or is that just a myth?
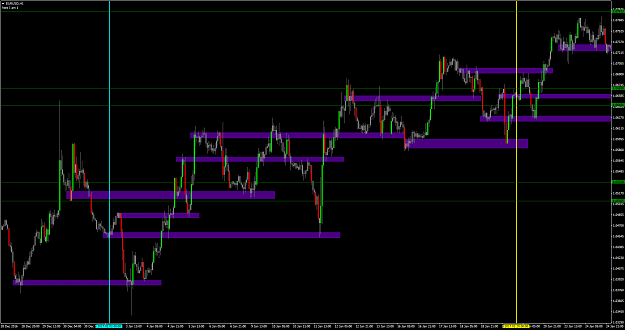
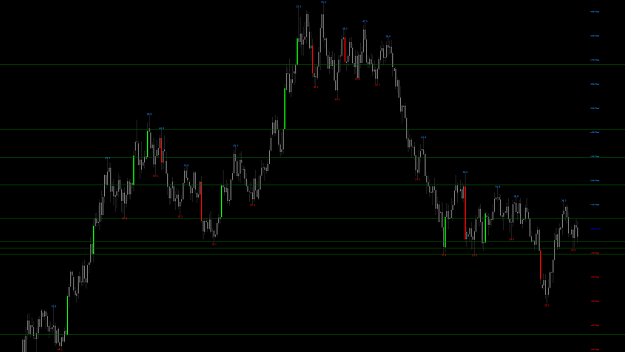
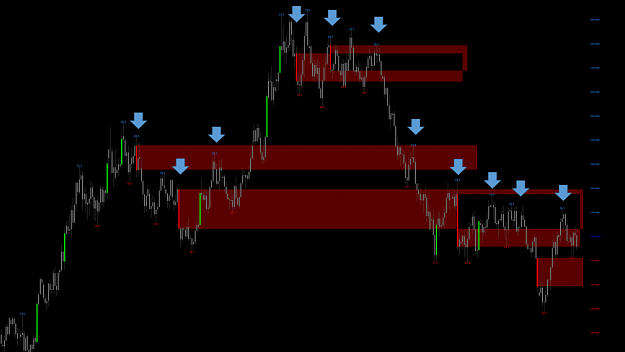
Let's first look at an H4 in the EURUSD from January 2018 to the end of April 2018.
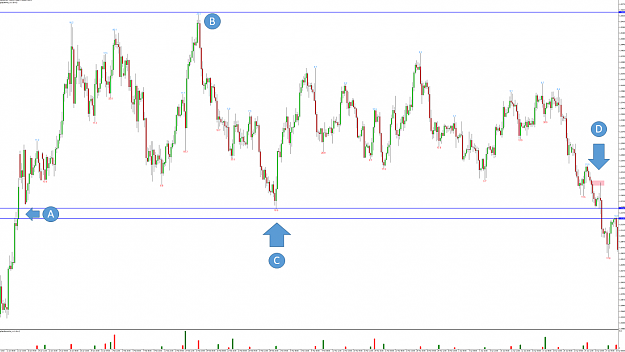
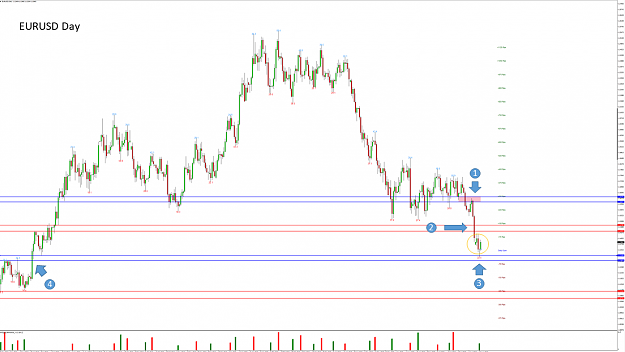
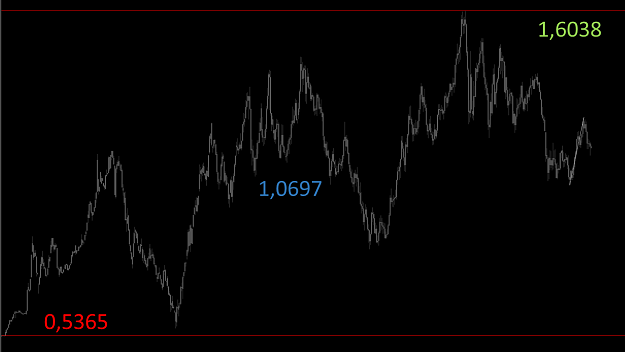
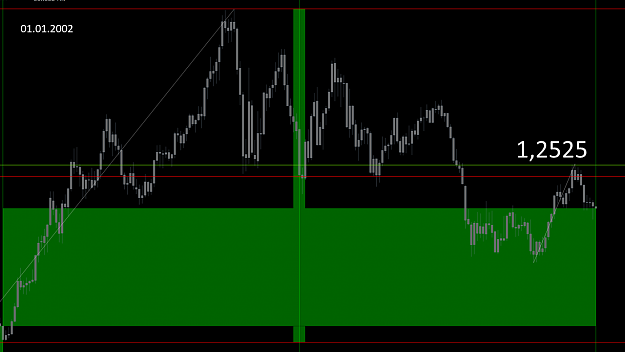
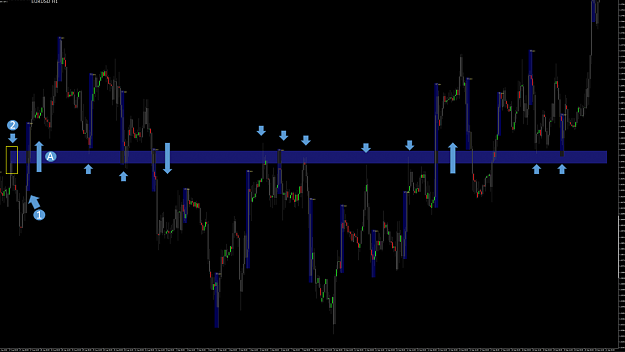
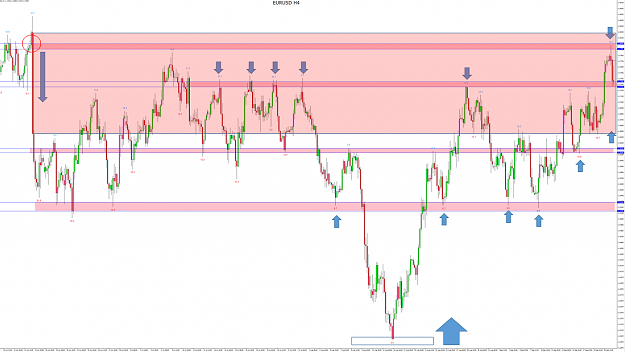
At the beginning of the year there was a strong uptrend, at point A a strong equilibrium was created, after which the price continued to rise sharply. There I have marked a resistance zone. The price was 1.255 (point B) and then came into my resistance zone at point C for the first time. The course was rejected and a great equilibrium was born. Thereafter, the price moved back to the resistance line and broke through at the point D. This point D we now look more closely at the M15 chart.
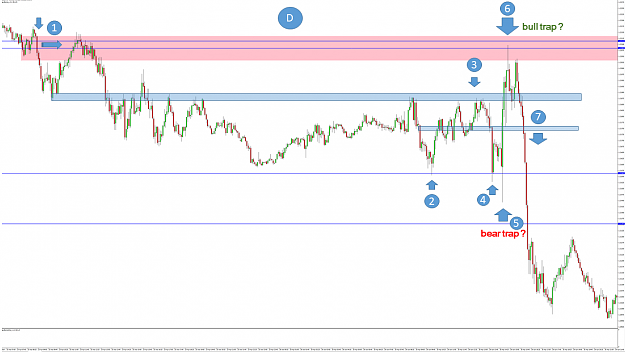
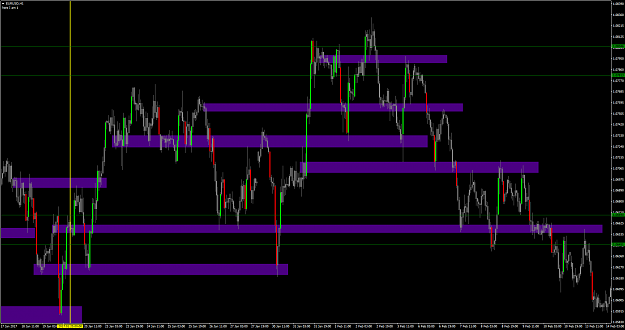
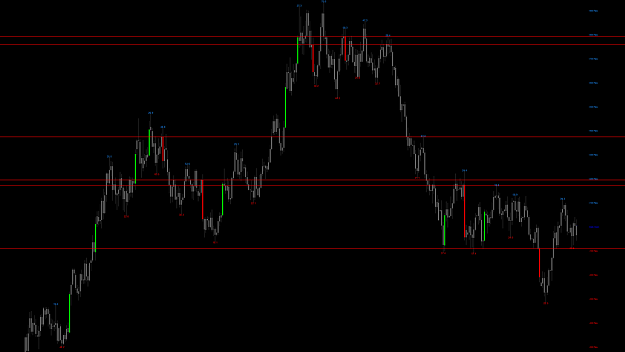
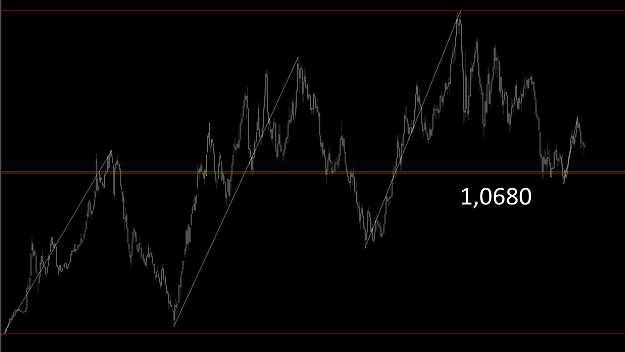
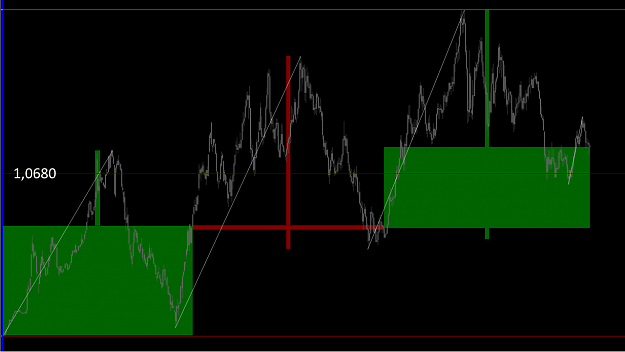
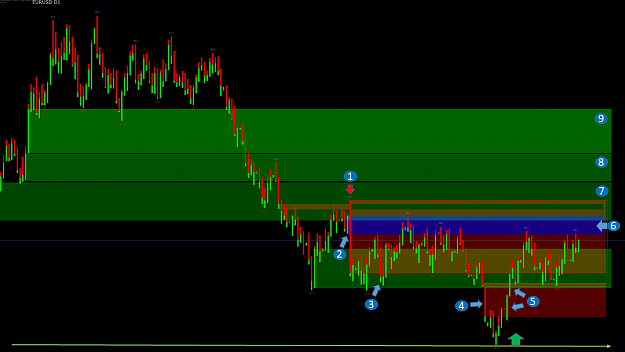
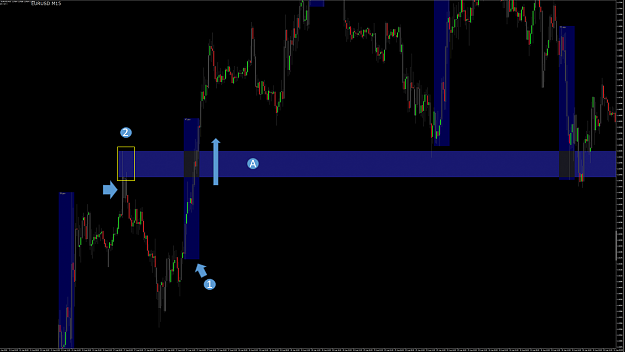
Due to the price development, I refined my in H4 pink drawn resistance line with two blue lines. In addition, I drew two more blue guides. From point 1, the course went slowly down. Shortly before the lower high resistance line he ran slowly up again. A clear equilibrium.
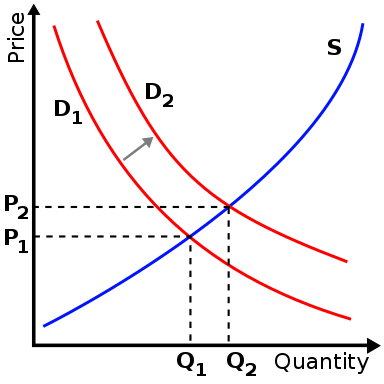
There are 3 different states in the market.
1. Offer outweighs the demand = price drops
2. Demand outweighs the offer = price rises
3. Supply and demand are balanced
1. Offer = Seller (short)
2. Demand = Buyer (long)
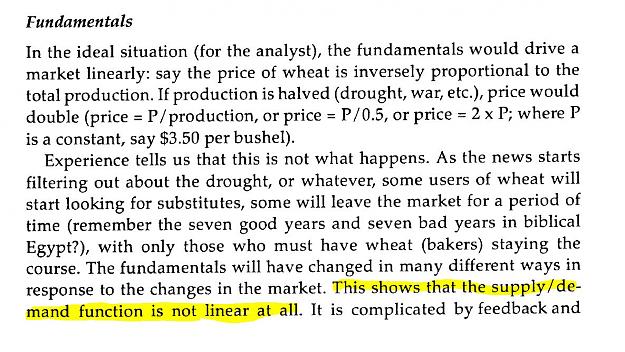
The quantity available on the market represents the supply, the demand is the quantity that the buyer would like to purchase. In the stock market environment, the price strives to find a so-called equilibrium. At that moment, buyers and sellers are equally satisfied until an imbalance rebalances in favor of supply or demand. Then the prices rise or fall again. These competing factors (supply and demand) meet each other in all markets and regulate the price.
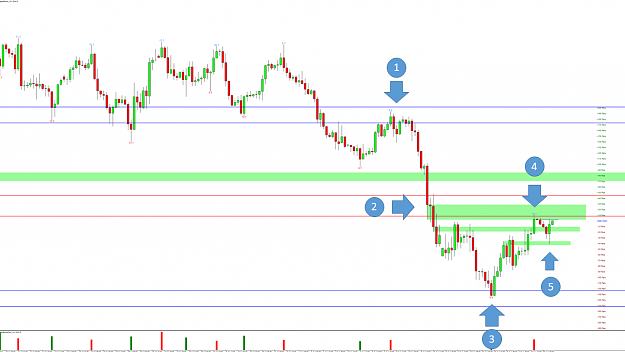
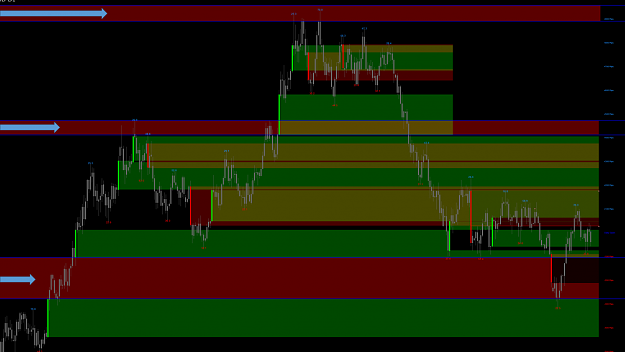
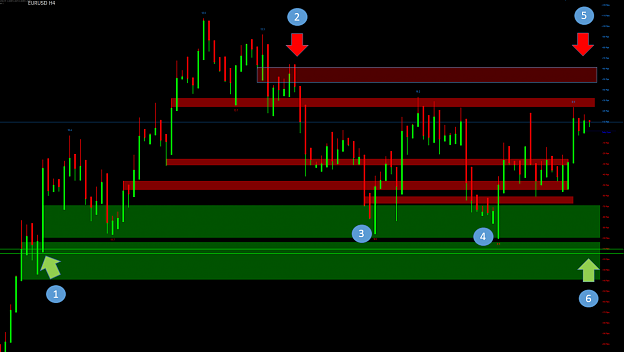
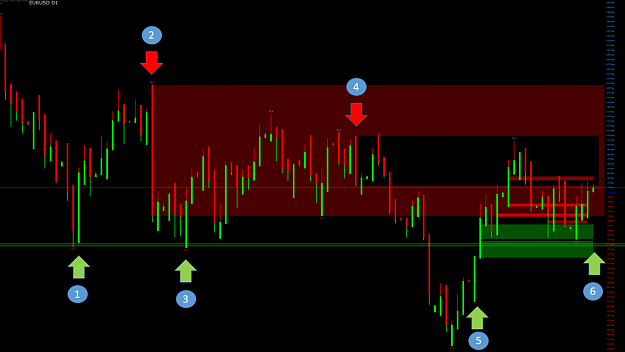
In the stock market environment, the price strives to find a so-called equilibrium. At that moment, buyers and sellers are equally satisfied until an imbalance rebalances in favor of supply or demand. Then the prices rise or fall again. At point 2, the course came after point C (Figure 1) for the second time in the resistance zone. He was a little more dismissed and ran into my drawn blue zone (point 3). From there he ran back down to the point 4 and came back into the resistance zone. This time around, the course was not so heavily dismissed and started a third time to break the zone. Some traders now make the mistake of placing a sell stop order below point 4. That would have gone well for just under 10 pip at point 5, after which the price went up by 66 pip (to point 6) and would have stopped many traders. Pay attention to what the course does after entering the blue resistance zone at point 3. The course was turned down, came into the large resistance zone and then ran back up. There he was rejected again and ran back into the big resistance zone. By now you should have noticed that the selling pressure is not strong enough to break the resistance zone. That means there are still buyers who need to be satisfied. Only at point 6, the buyers were satisfied and the seller could prevail. As the course went up again I realized that he could run down to the red zone at the latest. If you look at the overall picture in the H 4 Chart, it will be clearer. The upper red zone was therefore also a very strong resistance zone. So you could have taken the risk to trade down from that zone, or wait until point 7. Once the price broke the blue resistance line at point 7, you could trade down.
There is a fixed rule for me. I basically do not buy or sell in or after such a strong zone, but always far ahead. As the price tends towards this strong zone, I am able to set my stop to zero relatively quickly, and wait for what happens. Of course I can not know how the course develops exactly. The advantage is, as soon as the course comes back I am stopped out and have lost nothing. I can repeat this until the price breaks through the strong resistance zone and my plan with it rises. Some traders are also going to go below the resistance level above the entry level. It should be noted, however, that the course is only strong through the resistance line, shortly thereafter comes back the pullback. If I get in there that is not beneficial.
Twice the price has entered this strong resistance line and many traders have assumed that it would go through the third time. Of course, the big players knew that at the moment. As I have already written in some posts, is a trade of a big player is particularly successful if he takes as few traders with up or down. But you have to lure the other dealers first on the wrong track and then act in the opposite direction. This will stop all unwelcome traders and the big player can continue my way unhindered up or down. From the point of view of still young traders, there is a bear and a bull trap.
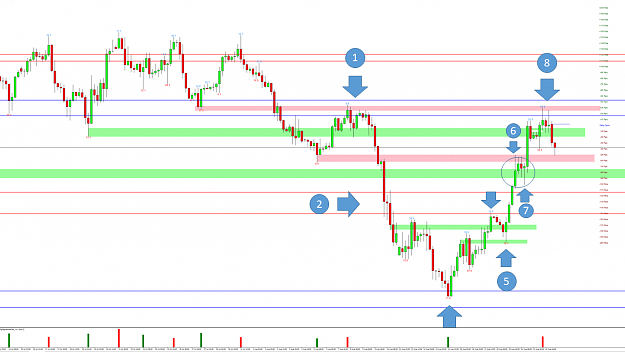
You can also see it differently. Three times the price has entered the strong lower resistance zone and three times there were not so many sellers on the market that the price could break through the zone. Therefore, the course had to run once again up to find enough sellers there. At point 6, enough sellers entered the market to push the price through the resistance zone. This can also be clearly recognized by the strong bearish candles. That's why I analyze supply zones and demand zones with the Equilibrium. This makes it faster to detect alleged bear and bull traps. Indicators are less reliable, at point 2,4 and 5 you have shown a clear downtrend while at point 6 a clear uptrend has been shown.
The dramatic thing is that the process is the same again and again, after some 10,000 hours of trading, you will experience the same thing. But you can abbreviate the whole thing by dealing with the Equilibrium. Record your supply and demand zones and quickly see where the price can possibly go. Of course, this is no guarantee because the price is always purely random, but the probability of making the right decision is significantly increased. I hope I could give you a little insight and wish you a nice weekend.
best regards
Hello dear traders,
you've heard or read it many times, what is a bull or bear trap? It is supposed to be a trap in which the investor, who expects falling or rising prices, invests on the basis of his analysis and subsequently turns out to be a misjudgment. Are these traps really, or is that just a myth?
Let's first look at an H4 in the EURUSD from January 2018 to the end of April 2018.
Attached Image (click to enlarge)
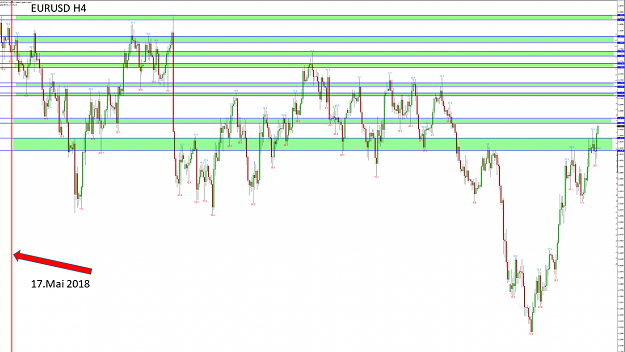
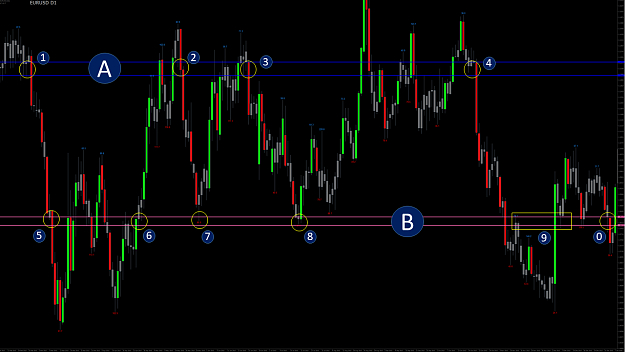
At the beginning of the year there was a strong uptrend, at point A a strong equilibrium was created, after which the price continued to rise sharply. There I have marked a resistance zone. The price was 1.255 (point B) and then came into my resistance zone at point C for the first time. The course was rejected and a great equilibrium was born. Thereafter, the price moved back to the resistance line and broke through at the point D. This point D we now look more closely at the M15 chart.
Attached Image (click to enlarge)
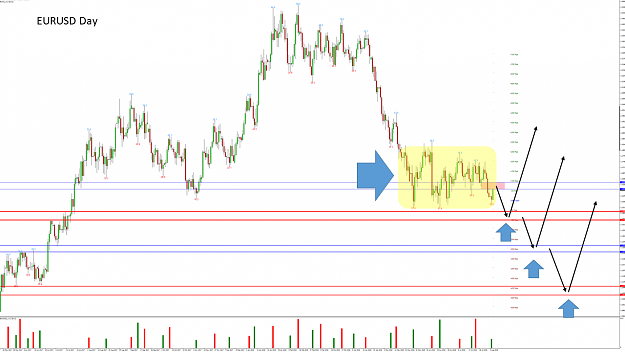
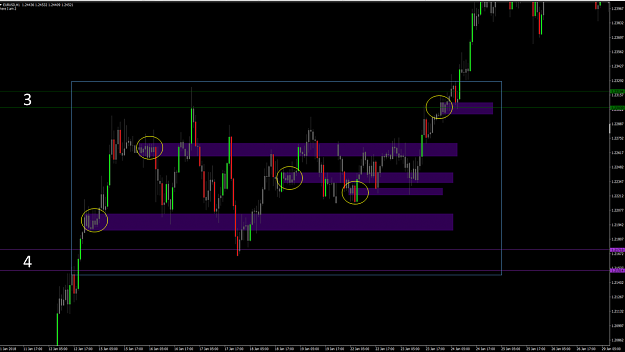
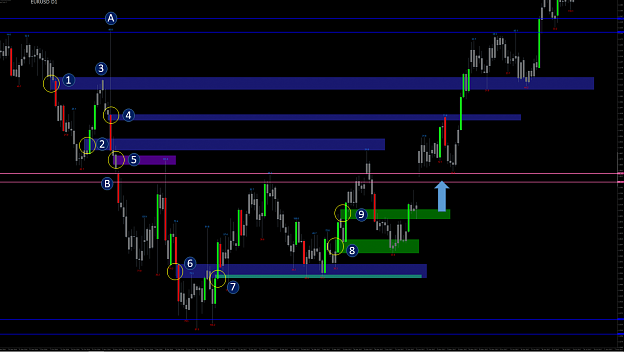
Due to the price development, I refined my in H4 pink drawn resistance line with two blue lines. In addition, I drew two more blue guides. From point 1, the course went slowly down. Shortly before the lower high resistance line he ran slowly up again. A clear equilibrium.
There are 3 different states in the market.
1. Offer outweighs the demand = price drops
2. Demand outweighs the offer = price rises
3. Supply and demand are balanced
1. Offer = Seller (short)
2. Demand = Buyer (long)
The quantity available on the market represents the supply, the demand is the quantity that the buyer would like to purchase. In the stock market environment, the price strives to find a so-called equilibrium. At that moment, buyers and sellers are equally satisfied until an imbalance rebalances in favor of supply or demand. Then the prices rise or fall again. These competing factors (supply and demand) meet each other in all markets and regulate the price.
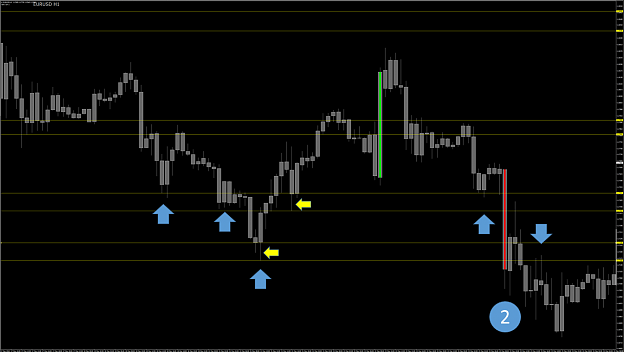
In the stock market environment, the price strives to find a so-called equilibrium. At that moment, buyers and sellers are equally satisfied until an imbalance rebalances in favor of supply or demand. Then the prices rise or fall again. At point 2, the course came after point C (Figure 1) for the second time in the resistance zone. He was a little more dismissed and ran into my drawn blue zone (point 3). From there he ran back down to the point 4 and came back into the resistance zone. This time around, the course was not so heavily dismissed and started a third time to break the zone. Some traders now make the mistake of placing a sell stop order below point 4. That would have gone well for just under 10 pip at point 5, after which the price went up by 66 pip (to point 6) and would have stopped many traders. Pay attention to what the course does after entering the blue resistance zone at point 3. The course was turned down, came into the large resistance zone and then ran back up. There he was rejected again and ran back into the big resistance zone. By now you should have noticed that the selling pressure is not strong enough to break the resistance zone. That means there are still buyers who need to be satisfied. Only at point 6, the buyers were satisfied and the seller could prevail. As the course went up again I realized that he could run down to the red zone at the latest. If you look at the overall picture in the H 4 Chart, it will be clearer. The upper red zone was therefore also a very strong resistance zone. So you could have taken the risk to trade down from that zone, or wait until point 7. Once the price broke the blue resistance line at point 7, you could trade down.
There is a fixed rule for me. I basically do not buy or sell in or after such a strong zone, but always far ahead. As the price tends towards this strong zone, I am able to set my stop to zero relatively quickly, and wait for what happens. Of course I can not know how the course develops exactly. The advantage is, as soon as the course comes back I am stopped out and have lost nothing. I can repeat this until the price breaks through the strong resistance zone and my plan with it rises. Some traders are also going to go below the resistance level above the entry level. It should be noted, however, that the course is only strong through the resistance line, shortly thereafter comes back the pullback. If I get in there that is not beneficial.
Twice the price has entered this strong resistance line and many traders have assumed that it would go through the third time. Of course, the big players knew that at the moment. As I have already written in some posts, is a trade of a big player is particularly successful if he takes as few traders with up or down. But you have to lure the other dealers first on the wrong track and then act in the opposite direction. This will stop all unwelcome traders and the big player can continue my way unhindered up or down. From the point of view of still young traders, there is a bear and a bull trap.
You can also see it differently. Three times the price has entered the strong lower resistance zone and three times there were not so many sellers on the market that the price could break through the zone. Therefore, the course had to run once again up to find enough sellers there. At point 6, enough sellers entered the market to push the price through the resistance zone. This can also be clearly recognized by the strong bearish candles. That's why I analyze supply zones and demand zones with the Equilibrium. This makes it faster to detect alleged bear and bull traps. Indicators are less reliable, at point 2,4 and 5 you have shown a clear downtrend while at point 6 a clear uptrend has been shown.
The dramatic thing is that the process is the same again and again, after some 10,000 hours of trading, you will experience the same thing. But you can abbreviate the whole thing by dealing with the Equilibrium. Record your supply and demand zones and quickly see where the price can possibly go. Of course, this is no guarantee because the price is always purely random, but the probability of making the right decision is significantly increased. I hope I could give you a little insight and wish you a nice weekend.
best regards
Forget:That does not work, amateurs build the ark, pros the Titanic!
4