• Home
  • Forums
  • Trades
  • News
  • Calendar
  • Market
  • Brokers
  • Login
  • Join
  • User/Email: Password:
  • 9:19pm
Menu
  • Forums
  • Trades
  • News
  • Calendar
  • Market
  • Brokers
  • Login
  • Join
  • 9:19pm
Sister Sites
  • Metals Mine
  • Energy EXCH
  • Crypto Craft

Options

Bookmark Thread

First Page First Unread Last Page Last Post

Printable Version

Similar Threads

Trading Price Pivots 735 replies

Trevs pivots trading 61 replies

Standard Pivots and Fibonnaci Pivots? 8 replies

Trading USD/JPY with only Pivots 2 replies

Need some help with Trig for new indicator 4 replies

  • Interactive Trading
  • /
  • Reply to Thread
  • Subscribe
  • 9
Attachments: 15 Minute Trig Trading W/Pivots
Exit Attachments

15 Minute Trig Trading W/Pivots

  • Post #1
  • Quote
  • First Post: Mar 28, 2010 9:05am Mar 28, 2010 9:05am
  •  Nene
  • | Additional Username | Joined May 2009 | 2,719 Posts
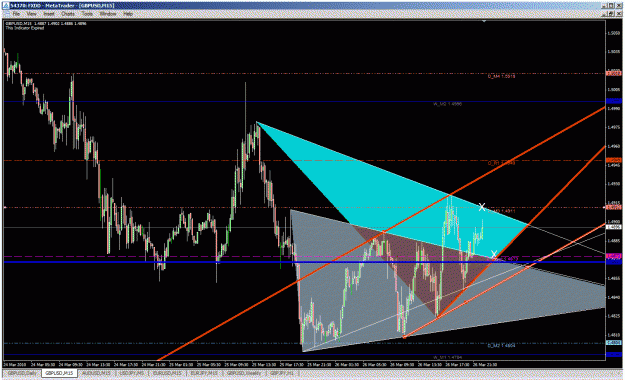
Hey Guys, I have been working on this for awhile now and I am now to the point where input is appreciated and needed. I call it Trig Trading with pivots. You work the Triangles until the price moves out. If there is no test then you adjust another Triangle in. Here is an example of how it looks on the 15 Min Timeframe. There is a formula that I use and can tell 80% of the time if the bounce will be good.

The following chart shows the G/U 15 min and the current action should be limited in the the DarkTurquoise Triangle and the Orange trendline channel markers. This is a waiting time now and I am waiting for the price to come to either of the white X's

Jim
Attached Image (click to enlarge)
Click to Enlarge

Name: gu.gif
Size: 56 KB
  • Post #2
  • Quote
  • Mar 28, 2010 9:35am Mar 28, 2010 9:35am
  •  Nene
  • | Additional Username | Joined May 2009 | 2,719 Posts
The formula I use is what I call long (Compounding Long Wicking). Using this formula at all lines of support and resistance will give you an 80% or better success rate of the bounce. Below is an example of what we are looking for.

Chart #1 we are wating mode and we see the price approaching an already defined UTL, ( See White Arrow ). We wait for a touch.

Chart #2 shows a touch and we need to apply the Simple formula to see if we got a good chance of a bounce long. The wick of the candle touching the line has to be longer than the previous wick, ( See White Arrows. If the formation exsists, we have a grat chance of going long here with a very tight stop. Target will be next line of resistance or support. In this case a 21 pip target with a 12 pip stop, I would be pulling half my profit here and moving stop to B/E.

Chart #3 shows a trendline break where I pull half off, however. You can see where the price came back and TESTED, The top of the line which is now support and formed a green candle which I would add my half back on. There is that word again, TESTED, I am a huge believer in these words, TESTED, FAILED, RESISTANCE and SUPPORT.

This trade is 48 pips long now with profit pulled and added. Keep in mind, pivot points rule the roost. If you hit one before the trendline, my advice is to get out.

Jim


Quoting Nene
Disliked
Hey Guys, I have been working on this for awhile now and I am now to the point where input is appreciated and needed. I call it Trig Trading with pivots. You work the Triangles until the price moves out. If there is no test then you adjust another Triangle in. Here is an example of how it looks on the 15 Min Timeframe. There is a formula that I use and can tell 80% of the time if the bounce will be good.

The following chart shows the G/U 15 min and the current action should be limited in the the DarkTurquoise Triangle and the Orange trendline...
Ignored
Attached Images (click to enlarge)
Click to Enlarge

Name: gu1.gif
Size: 50 KB Click to Enlarge

Name: gu2.gif
Size: 50 KB Click to Enlarge

Name: gu3.gif
Size: 52 KB
  • Post #3
  • Quote
  • Mar 28, 2010 9:42am Mar 28, 2010 9:42am
  •  Nene
  • | Additional Username | Joined May 2009 | 2,719 Posts
Notice the Black arrows, the formula does work. The wicks are opposite and the short one is hitting the line. So you stay out of the short. And by the way, common sense plays a big part so if you have none, goodby.

Jim

Quoting Nene
Disliked
The formula I use is what I call long (Compounding Long Wicking). Using this formula at all lines of support and resistance will give you an 80% or better success rate of the bounce. Below is an example of what we are looking for.

Chart #1 we are wating mode and we see the price approaching an already defined UTL, ( See White Arrow ). We wait for a touch.

Chart #2 shows a touch and we need to apply the Simple formula to see if we got a good chance of a bounce long. The wick of the candle touching the line has to be longer than the previous...
Ignored
Attached Image (click to enlarge)
Click to Enlarge

Name: gu4.gif
Size: 52 KB
  • Post #4
  • Quote
  • Mar 28, 2010 9:55am Mar 28, 2010 9:55am
  •  Nene
  • | Additional Username | Joined May 2009 | 2,719 Posts
Here is another example and the price is sitting on a buy signal, albeit, its Sunday and the entry would be 92.50 with a stoploss at 92.44 and a T/P at 92.63 but probably could go all the way to M3 Mid pivot. But its only an example and I do not advise trading this unless it gaps down.

Jim
Attached Image (click to enlarge)
Click to Enlarge

Name: uj.gif
Size: 42 KB
  • Post #5
  • Quote
  • Mar 28, 2010 9:58am Mar 28, 2010 9:58am
  •  Nene
  • | Additional Username | Joined May 2009 | 2,719 Posts
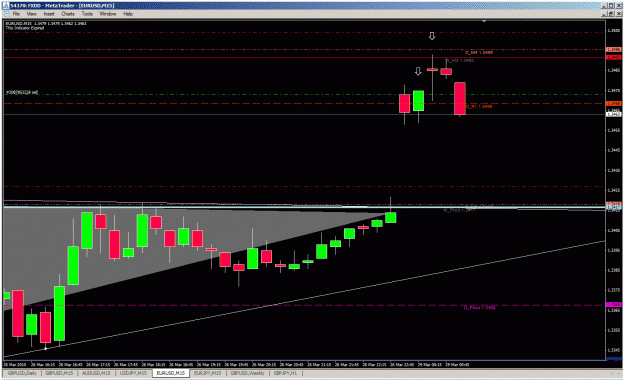
Here is a sell signal on E/U
Attached Image (click to enlarge)
Click to Enlarge

Name: eu.gif
Size: 47 KB
  • Post #6
  • Quote
  • Mar 28, 2010 10:15am Mar 28, 2010 10:15am
  •  Geppyg
  • | Commercial Member | Joined Mar 2009 | 1,421 Posts
Good Luck on your new thread NENE...

Geppyg
600 Pips a Month with Shahab and GeppyG Happy Trading Everybody....:D
  • Post #7
  • Quote
  • Mar 28, 2010 10:44am Mar 28, 2010 10:44am
  •  Nene
  • | Additional Username | Joined May 2009 | 2,719 Posts
Thanks, Geppy

Quoting Geppyg
Disliked
Good Luck on your new thread NENE...

Geppyg
Ignored
  • Post #8
  • Quote
  • Mar 28, 2010 10:53am Mar 28, 2010 10:53am
  •  fontu
  • Joined Mar 2008 | Status: Name real with real own way | 16,418 Posts
Congratulation Nene for a good thread & something new to us . Hope it will help a lot to us . will try understand how works .
thanks for the good works,
fontu
  • Post #9
  • Quote
  • Mar 28, 2010 1:25pm Mar 28, 2010 1:25pm
  •  frankkn
  • Joined Jan 2010 | Status: I'm the greatest, man | 2,514 Posts
woah..
  • Post #10
  • Quote
  • Mar 28, 2010 6:05pm Mar 28, 2010 6:05pm
  •  Nene
  • | Additional Username | Joined May 2009 | 2,719 Posts
I am shorting this
Attached Image (click to enlarge)
Click to Enlarge

Name: eu.gif
Size: 38 KB
  • Post #11
  • Quote
  • Mar 28, 2010 6:45pm Mar 28, 2010 6:45pm
  •  Nene
  • | Additional Username | Joined May 2009 | 2,719 Posts
Watching these areas for bounce on G/U.
Attached Image (click to enlarge)
Click to Enlarge

Name: gu.gif
Size: 43 KB
  • Post #12
  • Quote
  • Mar 28, 2010 6:54pm Mar 28, 2010 6:54pm
  •  Nene
  • | Additional Username | Joined May 2009 | 2,719 Posts
Up 38 on this trade

Quoting Nene
Disliked
I am shorting this
Ignored
  • Post #13
  • Quote
  • Mar 28, 2010 7:14pm Mar 28, 2010 7:14pm
  •  Nene
  • | Additional Username | Joined May 2009 | 2,719 Posts
+49

Quoting Nene
Disliked
Up 38 on this trade
Ignored
  • Post #14
  • Quote
  • Edited at 5:11am Mar 29, 2010 4:37am | Edited at 5:11am
  •  4xStar
  • Joined May 2009 | Status: Focus + Patience = Pip$ | 1,513 Posts
Great thread, I love trading the 15 min for short term & this looks like an enhancement on what I do. The only thing, I don't get how you draw the triangles. Could you provide a wider chart or more explanation as to how you define your triangle points?
******************* I'd rather make money than be right. :)
  • Post #15
  • Quote
  • Apr 24, 2010 6:07am Apr 24, 2010 6:07am
  •  @mel
  • Joined Dec 2009 | Status: I'm not a guy... | 240 Posts
Hi Nene,

Great thread here again. This methode is similar to mine. I don't use any indicators also, only trend line support & resistance and price action. I give a lot of importance to the the candle formation too.

I see that you have started different thread, I have read all of them. You really did a great job...

I've trief to post a reply on your scalping thread but I don't no why, my post does not appearhttp://cdn.forexfactory.com/images/icons/icon9.gif. i was wondering if you still use this methode to scalp the market.

Thanks,
Mel
  • Post #16
  • Quote
  • Last Post: Sep 13, 2018 7:43am Sep 13, 2018 7:43am
  •  voketexpert
  • | Additional Username | Joined Aug 2018 | 549 Posts
Wonderful technique, I am ready to backtest.
Profit growth tells you the trader ability.
  • Interactive Trading
  • /
  • 15 Minute Trig Trading W/Pivots
  • Reply to Thread
0 traders viewing now
Top of Page
  • Facebook
  • Twitter
About FF
  • Mission
  • Products
  • User Guide
  • Media Kit
  • Blog
  • Contact
FF Products
  • Forums
  • Trades
  • Calendar
  • News
  • Market
  • Brokers
  • Trade Explorer
FF Website
  • Homepage
  • Search
  • Members
  • Report a Bug
Follow FF
  • Facebook
  • Twitter

FF Sister Sites:

  • Metals Mine
  • Energy EXCH
  • Crypto Craft

Forex Factory® is a brand of Fair Economy, Inc.

Terms of Service / ©2021