Interesting and always a pleasure to see your progress as I do since over a year, my friend. Thanks.
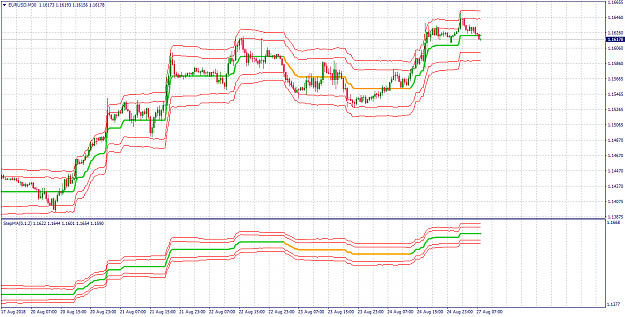
step one more average 2.3 mtf:
Maybe you play with higher sensitivity (Indi more horizontal then) to filter some sideways as I do as I siad earlier, with atr-bands, also, but unused in your package.
Which timeframe do you mainly trade?
Template 2 and 3: How do you use qwma, don't you trade long, when some are near over the candles? Are all qwma like on monthly really a help?
Where do you put sl tp1 and 2?
Which timeframe do you mainly trade? Template 2 and 3: How do you use qwma, don't you trade long, when some are near over the candles? Are all qwma like on monthly really a help? Where do you put sl tp1 and 2?
Ignored
hello, friend4you,
nice to hear from you,
qwma has many distinct advantages,
put qwma with your atr bands settings together and see, qwma line matches exactly with center line of your atr bands, that means that qwma is atr adjusted as we need it to be with price atr.(or your atr band or step oma) so it is very well coded.
because of this its signals are in line with step oma,(try them loading together),
so prices below qwma line suggests prices in lower atr zone(down move) and prices above qwma line suggests prices in upper atr zone(up move) as with step oma signals(or your atr bands) and as you use your atr style of trading, so everything is in sync with it.
______________________________________________________________________________________---
consider qwma line as step oma of that time frame(simply said 13 ema of that time frame, but with atr adjusted ),
____---------------------------------------------------------------------------------------------------------------------------------------
so qwma line of 1 minute time frame = 13 ema atr adjusted of that time frame(1 minute)(=step oma 2.3 mtfof 1 minute)
qwma line of 5 minute time frame = 13 ema of 5 minute time frame(atr adjusted)= 50 ema of 1 minute time frame
qwma line of 15 minute time frame= 13 ema(atr adjusted) of 15 minute time frame= 50 ema of 5 minute time frame= 200 ema of 1 minute time frame
so on for all time frames.
_________________________________________________________________________________________________________________________
you omit 30 minute time frame as it is out of sync, and above mentioned relation remains with all time frames,
so when i need to see on single chart screen what is happening on all time frames i load qwma of all time frames i trade. and it shows everything ,
e.g. -when 1 minute time frame qwma line breaks(13 ema), next target or support is 5 minute qwma line(50 ema of 1 minute frame = 13 ema(atr adjusted) of 5 minute frame) so on for all timeframes.
the same applies to sl mechanism, this will match with sl of your atr bands , as you use as qwma is matching with your atr bands.
so it is easy to see targets and sl on single screen
other thing is each time frame qwma = macd for that time frame(or stlm histogram of that time frame)(price swings), so i can see what is happening to macd(stlm histogram) on all time frames(all time frame swings) in single chart.
best trades are when qwma lines of two time frame are kissing each other,( e.g.- qwma lines of 1 minute and 5 minute are touching each other that means that atr ranges of both time frames are at their narrowest, and signals given by other indicator will have good price action( as again atr ranges of 1 minute and 5 minute time frames will expand)
for sell signal qwma line of lower time frame should be below higher time frame-(e.g.- 15 minutes qwma should be below 1 hour qwma to take sell trade-- what it means is that atr ranges of prices of 15 minutes is below the atr ranges of 1 hour time frame ) like wise i analyse from higher tf to lowe tf to see which signal is right(i.e which tf atr range is lower and which tf atr range is higher)
when prices breaks atr range of one time frame it enters atr range of next higher time frame that is easy to see with qwma-
(e.g first prices moves out of 1 minute atr range to enter 5 minute atr range then take pause at qwma line of 5 minute(center line of your atr band for 5 minute)(median points of price atr ranges of 5 minutes), then will move in atr range of 15 minutes to hit qwma line of 15 minute tf(center line of your atr band for 15 minutes)(median points of price atr ranges of 15 minutes) and will pause there,,,,,.... so on for all tf. so this lines(higher time frames are targets and sl)
macd(stlm histogram) more or less behaves in line with atr ranges so shows moves in sync with qwma of time frame
one version of qwma was released in 2016 that i was using and now new one is released, attaching both here
Hi Brijesh. Could you please give the .rar or .zip set up chart you often used?
I saw it many indicators, and i cant decide which one is the most effective.
{quote} Hi Brijesh. Could you please give the .rar or .zip set up chart you often used? I saw it many indicators, and i cant decide which one is the most effective.
Ignored
you can first try it on demo or strategy tester with your system you use for trading to see what suits you the best,
the one which brings you close to winning probability is good enough as there is no holygrail available.
{quote} hello, friend4you, nice to hear from you, qwma has many distinct advantages, put qwma with your atr bands settings together and see, qwma line matches exactly with center line of your atr bands, that means that qwma is atr adjusted as we need it to be with price atr.(or your atr band or step oma) so it is very well coded. because of this its signals are in line with step oma,(try them loading together), so prices below qwma line suggests prices in lower atr zone(down move) and prices above qwma line suggests prices in upper atr zone(up move)...
Ignored
Thanks, but isn't it disturbing, not to take a long trade just because some much higher timeframe qwma is above actual price? How do you determine sl tp?
Which alert or strength indicator do you use to find the most volatile pair?
I added a new stema with atr-bands, but I prefer the standard one. Some mq4 versions are in my older posts here.
Attached Image (click to enlarge)
As I tried to tell you last year, atr bannds is normal ma! The atr volatility calculation is only for the bands distance. When you deactivate the outer bands, you have a normal ma
as usual:
0=sma, 1=ema, 2=smma, 3=lwma
0=close, 1=open, 2=high, 3=low, 4=median, 5=typical, 6=weighted
{quote} Thanks, but isn't it disturbing, not to take a long trade just because some much higher timeframe qwma is above actual price? How do you determine sl tp? Which alert or strength indicator do you use to find the most volatile pair? I added a new stema with atr-bands, but I prefer the standard one. Some mq4 versions are in my older posts here. {image} As I tried to tell you last year, atr bannds is normal ma! The atr volatility calculation is only for the bands distance. When you deactivate the outer bands, you have a normal ma as usual: 0=sma,...
Ignored
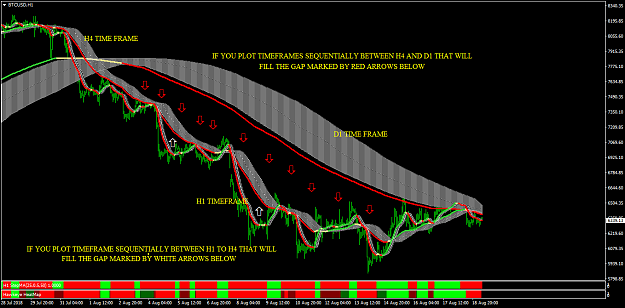
when two time frame qwma comes at touching distance to each other it means that all lower time frames averages are converging( all lower time frames atr are converging) this are best opportunities for trade, as again all lower time frame averages will diverge, in mt4 there is restriction of time frame to be used to limited time frames available, so qwma helps to see what is happening to all lower time frames, see attached image. (try using qwma templet on odd time frames like 23 minutes, 45 minutes, 33 minutes ...... so on, to see what i mean, using period converter indicator)
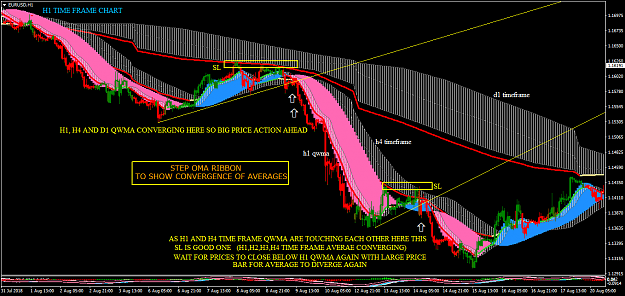
oma ribbon does the same thing to show convergence and divergence of lower time frame averages as is macd. stlm histogram shows the same , in which direction averages are converging and diverging.
you can reduce qwma time frames to be loaded on chart, keeping next 2 higher timeframes, to keep chart clean , as all lower timeframes will align to higher timeframe trend always.
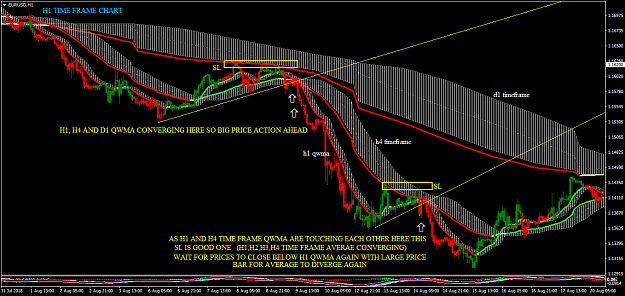
I use this convergence of qwma of multitime frames,( multitime frame convergence of averages to find when price strength will come, (This is followed by divergence of multitimframe averages again)
when two time frame qwma are touching each other, that price high or low are good sl, as in trending market that will not be tested as in image
{quote} when two time frame qwma comes at touching distance to each other it means that all lower time frames averages are converging( all lower time frames atr are converging) this are best opportunities for trade, as again all lower time frame averages will diverge, in mt4 there is restriction of time frame to be used to limited time frames available, so qwma helps to see what is happening to all lower time frames, see attached image. (try using qwma templet on odd time frames like 23 minutes, 45 minutes, 33 minutes ...... so on, to see what i...
Ignored
Hello Brijeshinh,
Could you please add the indicators and templet, that you are using on this post?