{quote} Smart call bro. Target 1.31000.TP1. Target 1.31500 TP2. Next target 1.32500 as long as price stays above 1.30800. Good luck.
Ignored
Hey Ron thanks for all of your help man, it’s very much appreciated. One small request, if you have spare time would it be possible to video record how you approach you PA and decision making just like Neil did in his video. I, like most people are visual learners and a video showing how you approach PA and choose your levels would be very helpful. TYVM
{quote} Hey Ron thanks for all of your help man, it’s very much appreciated. One small request, if you have spare time would it be possible to video record how you approach you PA and decision making just like Neil did in his video. I, like most people are visual learners and a video showing how you approach PA and choose your levels would be very helpful. TYVM
Ignored
Video? Must have missed that one...searched but couldnt find it..
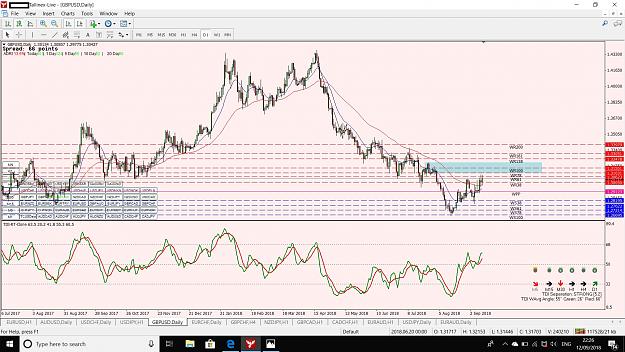
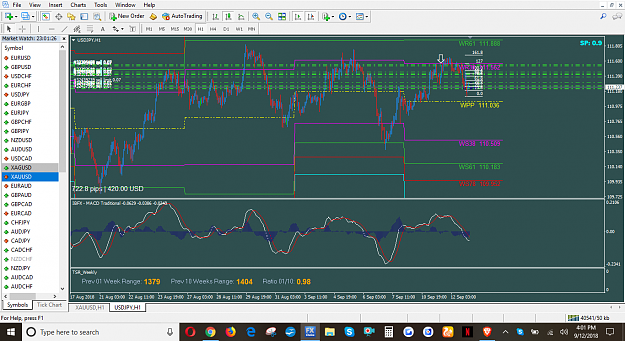
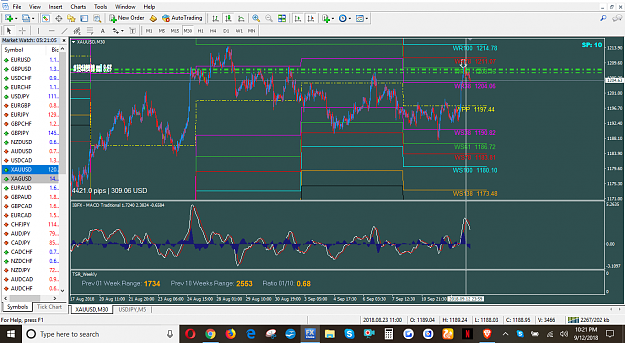
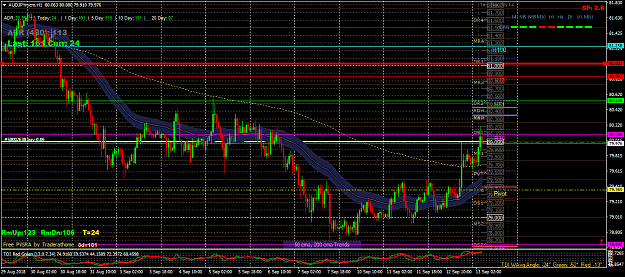
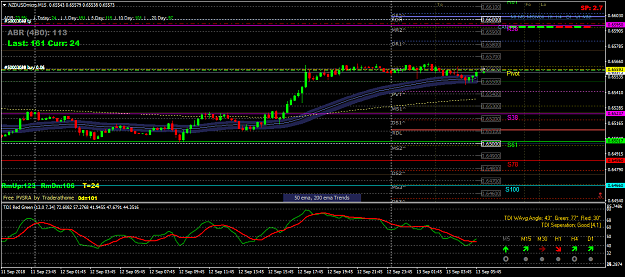
Hi guys, Just to let you guys know that EURUSD and GBPUSD is preparing for a breakout. Good luck!! I’m done for this week. Big Risk for tomorrow ECB and BOE Rates Decision. Pls remember to secured your PROFITS. Ron. {image} {image}
Ignored
U & DAVIT R THE BEAST!!! You hammer it hard when necessary...following your footsteps
Joined Jul 2017
|
Status: Active member
|1,655 Posts
The video analysis I did on GU if you notice where the top of that lower high is that perticular zone ranges from WR78 to WR138 I trade the daily TF, if price breaks the WR138 I will be bullish as a break of this will break the lower high.
i want you guys to look at you GU chart and draw a zone box from WR78 to WR138
if price breaks 138 we are more than likely starting a bullish trend.
Huge speculation but but I think tomorrow we will get a nice spike into that box you guys have just drawn on your charts followed by a drop. Let’s be honest Brexit is in s*** state it be stupid to buy the pound with so much uncertainty
The video analysis I did on GU if you notice where the top of that lower high is that perticular zone ranges from WR100 to WR138 I trade the daily TF, if price breaks the WR138 I will be bullish as a break of this will break the lower high. i want you guys to look at you GU chart and draw a zone box from WR100 to WR138 if price breaks 138 we are more than likely starting a bullish trend. Huge speculation but but I think tomorrow we will get a nice spike into that box you guys have just drawn on your charts followed by a drop. Let’s be honest Brexit...
Ignored
Nice analysis bruv. Im steering clear of GBP and CAD pairs for at least a couple of weeks. Seems anyone with a twitter account can move the pound lol
Joined Jul 2017
|
Status: Active member
|1,655 Posts
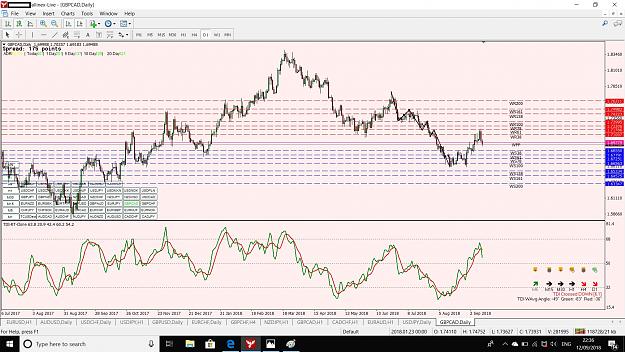
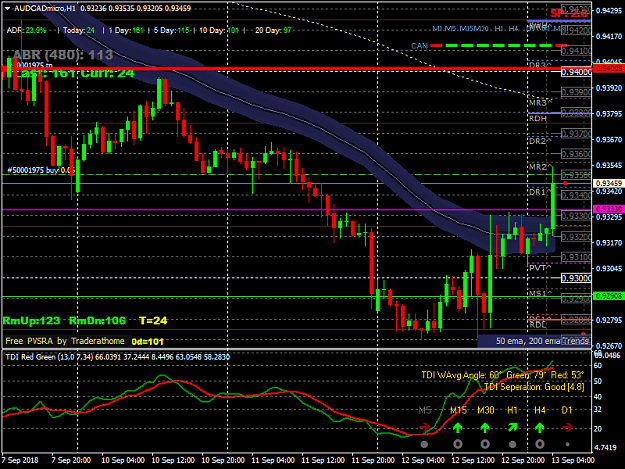
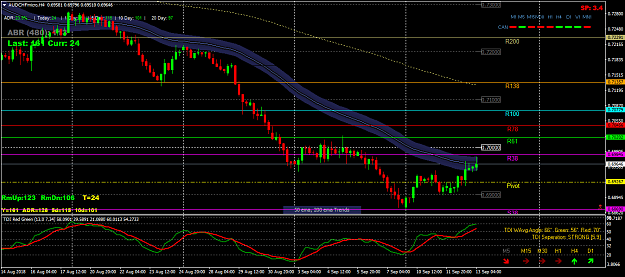
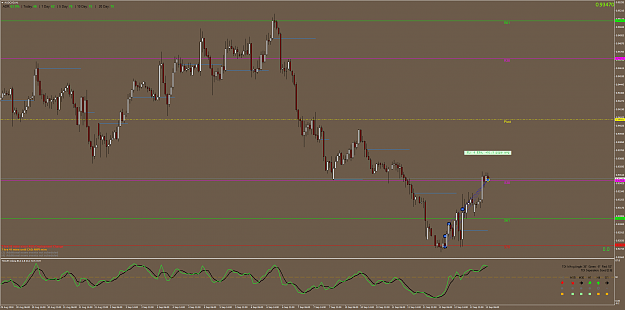
Heres an example of GC
now we have to be wary of cad pairs like davit said before however look at this. This is what I want you guys to do.
3 Questions all you need to ask yourself
What
Where
When
Q1-What is my trend?.....in this case the GC is in a downtrend so we are EXPECTING a new Lower low (does not mean this will 100% happen)
Q2-Where is my latest area of structure that price will continue with the trend?......in this case we have a opportunity at the bottom of lower high at pivot point R38 and finally the top of the lower high at pivot R61....note if price breaks R61 in this case we would be considered in a potential bull market as it was the last lower high to form the lower low.
Q3-When?...….again as above when will I enter the market in our case it would be either R38 or R61 once price action rejects.
Note how we accurately predicted where price would turn bang on R61
It is that simple guys.
We as humans over complicate things.
Hope this sheds light for people
Note how TDI wasn't even mentioned pure price action
That's around 250 pips placing 1 trade.. now if you stacked your orders 500 pips on two trades etc
Some traders only aim for 20 pips a day that's 100 a week based on mon-fri, that's 400 a month and you've made there monthly target in 2 days lol see the power of this now?
The video analysis I did on GU if you notice where the top of that lower high is that perticular zone ranges from WR78 to WR138 I trade the daily TF, if price breaks the WR138 I will be bullish as a break of this will break the lower high. i want you guys to look at you GU chart and draw a zone box from WR78 to WR138 if price breaks 138 we are more than likely starting a bullish trend. Huge speculation but but I think tomorrow we will get a nice spike into that box you guys have just drawn on your charts followed by a drop. Let’s be honest Brexit...
Ignored
Has the rising wedge been broken on the GU daily or is that still active? End of yesterday it looked like price was going to close above the swing high from the 30th August, but then at rollover the spread increased and then it actually closed just below that swing high tail 1hr ago.
{quote} Has the rising wedge been broken on the GU daily or is that still active? End of yesterday it looked like price was going to close above the swing high from the 30th August, but then at rollover the spread increased and then it actually closed just below that swing high tail 1hr ago.
Ignored
we closed above now buddy so that now becomes invalidated. This is why im pretty sure we will get a spike into that top of that lower high as there was no reaction from the lower part of the lower high last chance to reverse is now at top of the lower high. (This will cause a double top on low tf if it spikes) if for what ever reason we break that zone we are bullish and need to look for buys in the s zone.
Heres an example of GC now we have to be wary of cad pairs like davit said before however look at this. This is what I want you guys to do. 3 Questions all you need to ask yourself What Where When Q1-What is my trend?.....in this case the GC is in a downtrend so we are EXPECTING a new Lower low (does not mean this will 100% happen) Q2-Where is my latest area of structure that price will continue with the trend?......in this case we have a opportunity at the bottom of lower high at pivot point R38 and finally the top of the lower high at pivot R61....note...
Ignored
Easy as you said. However, the problem with most traders is greed and lack of patience. It happens to me. When you have high accuracy to predict you will tend to over leverage and risk more especially with low capital for trading