{quote} It is not possible to add Yearly-S/R-lines in an easy way, as MT4 does not have this timeframe. {quote} I allowed myself to add lower timeframes to the code, so I attach it here since I don't know how to add changes on GitHub. {file}
{quote} No idea ;-) guess something went wrong with compilation ?? Can you try this one. its the same version as on GitHub, but compiled in a ex4 {file}
Ignored
Dear ebeckers,
I would like to thank you for your help and sustained endurance here. I am sorry to be a pain, but this latest version of the indicator that you kindly posted (while it does work on MT4) does not include your latest version that included M30 and M15. That one, I still can't get to load. Is there any way I could prevail on you to manage an ex version that includes M30 and M15 options please ? Once again sorry to ask an already busy and very positively contributing member.
Hi everyone, I have decided to share a S&R indicator I have been working on and need some help. For my trading style I find 1 hour S&R is good as most highest and lowest points reverse at these levels on a 1 min chart (I'm a 1 min chart junkie for intraday trading). However using the freely available S&R indicators based on fractals I find they are a few bars behind and difficult to use for an EA. The idea is to have the data buffers for playing with.
So I decided to recode S&R using the High(iHighest) code; the indicator is called resistance line. This generates a continues line for the resistance level at present but I would like the output to match that of a fractal S&R indicator I have, i.e. identical lines in length and price value. The resistance line nearly matches but there maybe an i shift issue and may others. Grateful for any help as I tend to be a trial by error coder, but this has not stopped me so far.
To view what I mean put both indicators on a 1M chart. Grateful for all and any help, comments. The indicator may or may not be possible.
Great MTF SR indicator! Can you make the SR lines infinite? I use it to see if it coincide with the SupportResistance indi, the one i was asking for alerts. U can check out this thread https://www.forexfactory.com/showthread.php?t=713593 where they use the SR indicator trying to make a good EA. I see they abandoned the EA idea for now but are still using it for alerts. The point of that strategy is to see if a resistance was hit, then when price comes back and meets some criteria, like an oscilator, MA, news are in line, an alert is given to sell.
They use it for D1 charts, but i've been somehow succesfull on M5 chart with H4 SR lines.
Also, on your indi, if i put False on display_period_1 (2,3,4), it still shows. Can you fix that?
Maybe if you want to develop this indi further u can add MTF fibo lines. Some ppl call this fibbo marriage, a place where 2 or more fibo lines coincide and a SR line line is also there, making the SR more in to take into consideration. For example, have a resistance line called D1 resistance line 50 monthly fibo line on the same line.
I use the EA on that thread on M5 chart with H4, D1, W1 SR and with your indi also set to H4, D1, W1 TF.
That EA is multi pair scanner and only need 2 charts open, the one with the EA for alerts and another one where i check if alert is good.
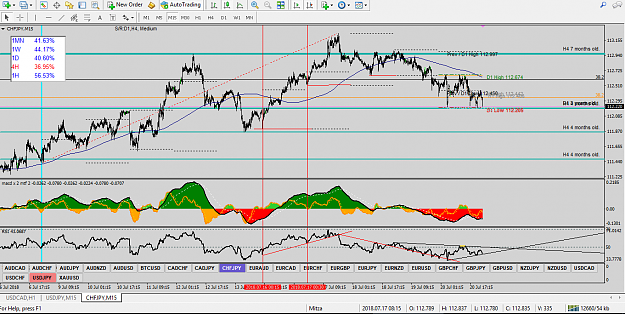
1st screenshort = me on M15 chart showng a D1 resistance and a 50 monthly fibo being hit and price bounced back
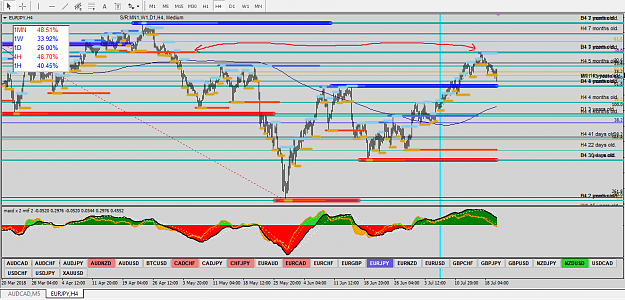
2nd screenshot = H4 chart showing how an older D1 support can become a D1 resistance. Is the same line from M15 chart.
Is there a reliable Support and Resistance Indicator ? What is your best one ? What I am searching for is something that can recognize support and resistance zones that are very close to the ones made by expert traders. I am ready to develop such an indicator if it is not available, or improve an existing one if any. This is an R&D work, and all findings will be shared here.
Ignored
Trading view gives you a lot of chart options and some of them show resistances and supports!
Hi Mitzescu, thanks for the feedback. I had a look at the thread and ebeckers S&R indicator also available on GitHub is very good. The MTF S&R indicator is ok but suffers from being based on fractals like many others. This means in practice the MTF S&R does not update in a timely fashion and on regular basis have to reload the indicator. Given the reason for this thread as reminded by Zlattata, like Abokwaik I believe there maybe a better way of deriving the S&R hence the resistance indicator as I think it will update in real time and present it as a starting point, maybe?
Hi this is my next attempt at deriving a better S&R using a pivot point indicator as a starting place. See what you think. V1 and V2 use slightly different time frames. It is not that V2 is an improvement over V1; need to look at both and provide feedback.
I agree trading view does a have some good S&R indicators the problem is recoding the indictors for MT4, sometimes easy, sometimes not.
Great job Ronin. Horizontal lines a belive are the most powerfull.
I've been testing your indicator. I've tried hiding H1, H4 lines and text, but they don't dissapear.
I've been trying to make some sense from D1 highs and lows. I've seen you offset the lines to the right. You should put them right under or above the price that created that high or low and put an option to double extend them if anyone wants this. There is an option to extend them to infinite, but there will be too many lines and chart becomes messy.
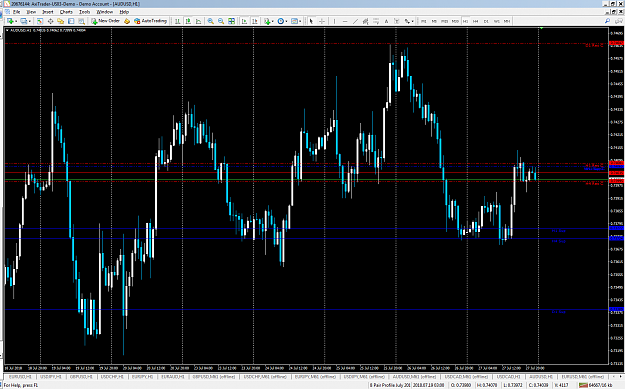
Back to how i see these highs lows can be used. Before i post a screenshot i test the theory on many pairs so here it is. I've draw some lines to extend those lows so i can better see them according to RSI.
Those D1 high lows can be used like in this screenshot. Trendlines can be drawn on Rsi according do D1 lows. See how rsi brokeout and made a divergence upthere? That's a great way to use it.
Another example and is good for the starting week. U see how the price tested your support 3 times and RSI is bullish divergent. Even Macd is bullish divergent.
If u can, please make so that previous lows and highs have different colors, they start from their original point and make an double extend the line option.
Version 1 of S&RHiLow does not show the lower time frame lines that you wish to be absent from the chart. Please ignore text next to lines, lets get the concept / indicator working then it can be polished. The H1 and H4 lines can be turned off on V2 by making sure Show_Previous is false and current is false. The shift maybe due to being based on pivot points at the beginning, see if I can doing something but not the best coder. Thanks for the feedback and will look into the other suggested changes.
Looking at the V2, it reminded me of another hypothesis to research of overlapping support lines and overlapping resistance lines of different timeframes. See https://www.tradingview.com/script/8...Points-Custom/ same principle using pivot points.
If you like the H1 previous to go back a full day change the CountDays to 24;
{quote} Hi Khalil, I always follow your thread, all of your thread are worth a lot. I normally use the attached indi. (It's not mine, I have downloaded from FF only) Credit goes to developer. {file}
Ignored
Hie subbusuper thanks for the indicator helps allot
The shift of S&RHiLow can not be changed as for a given period of time a higher high or low lower may occur which will then move the S / R line so the trader will not know if in that time period the price has reached the highest point / lowest point. This is why pivot points use the last time period to calculate the levels. For S&R fractals are often used but do lag a few bars and may not always show the current level without reloading the indicator. This can be seen by using strategy tester in MT4.
An alternative is S&R Indicators that use previous levels such as support and resistance # TLB as an example or use zigzag etc... A search also shows that PSAR might be used to identify potential S&R levels: https://www.mql5.com/en/code/10971. I have modified this indicator to allow different time frames; see what you think. All credit for the indicator goes to Brooky (marc weedbrook
I have played with the resistance line indicator and have come up with S & R Bands. There is a small lag for the bands to coincide with the fractal S&R. The S&R bands look like Bollinger Bands but encompass all the price action. The S&R Bands also match the support and resistance # TLB lines at places. See what you think.
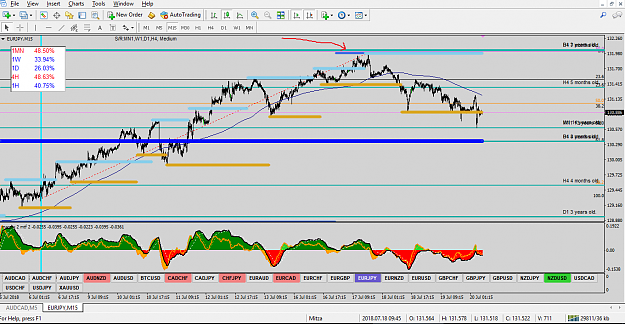
This marketpanel indicator with many different and strong lines like RWL-RDL-RHL AND Pivots MS 1,2,3 SS 1.2.4 and more i am sure...remember the dll on...For clock and open closed markets and price and more
Hi All,
I have been using this extremely helpful SR indicator (see attached) and have been following this thread with interest.
I would firstly like to thank the coder for this indicator if I knew who they were. It has appeared on quite a few threads - and under different names - so it has definitely proven popular due to its simplicity.
There is one small limitation with it though... the colours are fixed and very hard to see on a dark screen. I prefer a dark screen as it is more comfortable to view but the red and blue colours don't make it easy for older eyes like mine.
I am not a coder and get nervous changing code lines. So if any helpful soul out there can identify for me a simple SR indicator that looks like this but had selectable colours I'd be very very grateful. Or could re-code this one. I suspect others would gain a lot of benefit from this too.
weekly highs/lows, monthly highs/lows and daily highs lows are reliable only as far as interest rates expectations remain same, if there are changes to expected changes in interest rates expectations , all historical s/r becomes useless.
So there is no reliable long term indicator, impossible to make one.