• Home
  • Forums
  • Trades
  • News
  • Calendar
  • Market
  • Brokers
  • Login
  • Join
  • User/Email: Password:
  • 10:07pm
Menu
  • Forums
  • Trades
  • News
  • Calendar
  • Market
  • Brokers
  • Login
  • Join
  • 10:07pm
Sister Sites
  • Metals Mine
  • Energy EXCH
  • Crypto Craft

Options

Bookmark Thread

First Page First Unread Last Page Last Post

Printable Version

Similar Threads

Difference between buy/sell stops & buy/sell limits 34 replies

Difference between buy limit, sell limit, buy stop, & sell stop? 4 replies

how to change buy to sell, sell to buy for EA 1 reply

the buy/buy or sell/sell currency broker?? 5 replies

I am looking for EA to put Buy Stops, Buy limits, Sell limits, and Sell Stops. I will 0 replies

  • Trading Discussion
  • /
  • Reply to Thread
  • Subscribe
  • 6
Attachments: How to buy/sell the dips in a trend?
Exit Attachments

How to buy/sell the dips in a trend?

  • Last Post
  •  
  • 1 Page 2
  • 1 Page 2
  •  
  • Post #21
  • Quote
  • Jun 22, 2018 1:10am Jun 22, 2018 1:10am
  •  yonnie
  • Joined May 2008 | Status: Member | 1,125 Posts
Quoting VEEFX
Disliked
{quote} Hmm.. what does entry timeframe have anything to do with trade duration or trading style? There is absolutely no correlation between the two. I can trade on 1 second chart and hold the trade until friday. In fact, I can scalp or swing or position trade literally 100s of timeframe combinations round the clock. Timeframes, market conditions and trading style has absolutely no dependance....or I should say it has dependance only if you are a visual chartists/trader. P.S. I have not read the thread. I am responding only to this post and omly...
Ignored
good day to you Vee.
I just mention this to the thread starter in case he/she would like to trade the higher TF`s.
I think feb2850 got a good thread about following the trend on the higher TF without any indicators at all.
In a nutshell: he`ll wait for a pull back; 1 daily candle back into the direction of the main trend and another daily candle to "confirm" that the trend has resumed and buys/sells at the open of the 3rd candle.
  • Post #22
  • Quote
  • Jun 22, 2018 1:19am Jun 22, 2018 1:19am
  •  RaysJourney
  • | Joined Nov 2017 | Status: Member | 178 Posts
Quoting VEEFX
Disliked
{quote} Hmm.. what does entry timeframe have anything to do with trade duration or trading style? There is absolutely no correlation between the two. I can trade on 1 second chart and hold the trade until friday. In fact, I can scalp or swing or position trade literally 100s of timeframe combinations round the clock. Timeframes, market conditions and trading style has absolutely no dependance....or I should say it has dependance only if you are a visual chartists/trader. P.S. I have not read the thread. I am responding only to this post and omly...
Ignored
Regarding your "PS", that's alright as long as it doesn't start a new discussion since I'd like to keep talking about my original first post.

So far great inputs and insights which helps me in my journey!
  • Post #23
  • Quote
  • Edited at 1:48am Jun 22, 2018 1:37am | Edited at 1:48am
  •  mike22
  • | Joined Sep 2009 | Status: Member | 72 Posts
Ok... so... you are using a 50 EMA but you are missing/passing trades that are shorter pullbacks.

Hmmm... Allow me to suggest putting a 10EMA on a chart and see how many of those pullbacks

you missed line up with that.

Then do the exact same thing with the center line ("the mean") of a set of Bollinger Bands, which

is the equivalent of a 20 SMA.

Then there is also the 34 EMA and the 55 EMA. Same thing with these too.

BTW, Many traders trade in the direction in which

the 34 EMA is above or below the 55 EMA on the 4 hour chart.

And lastly, if you are asking yourself why numbers such as 34 and 55... they are both

numbers in the Fibonacci sequence.
  • Post #24
  • Quote
  • Jun 22, 2018 2:07am Jun 22, 2018 2:07am
  •  RaysJourney
  • | Joined Nov 2017 | Status: Member | 178 Posts
Quoting mike22
Disliked
Ok... so... you are using a 50 EMA but you are missing/passing trades that are shorter pullbacks. Hmmm... Allow me to suggest putting a 10EMA on a chart and see how many of those pullbacks you missed line up with that. Then do the exact same thing with the center line ("the mean") of a set of Bollinger Bands, which is the equivalent of a 20 SMA. Then there is also the 34 EMA and the 55 EMA. Same thing with these too. BTW, Many traders trade in the direction in which the 34 EMA is above or below the 55 EMA on the 4 hour chart. And lastly, if you...
Ignored
The reason why I haven't added a faster MA so far is due to the 50 EMA being very popular and I believe it's popular as it is very reliable. From my own observations, if price surpasses the 50 EMA by "a lot", it often is a sign of a full-blown reversal (of course, depends on the steepness) and when looking at price action, it often breaks the previous significant high or low, indicating possible reversal. Also, when price goes back to the 50 EMA within a trend, it often indicates a "deep enough" retracement for me, thus, I get a better entry within the trend.

I am not very familiar with faster MAs and how reliable they are. Often I have the feeling that the faster the MA, the lower the chance of winning the trade? Why? Because the retracement is not deep enough to find a good entry, EXCEPT I have a much bigger SL (i.e. above/below the previous swing).

Also, on a live chart, how will I know that this exact trend will be strong and finding an entry on the faster MA will work out?

For me personally, once it pulls back to the 50 EMA and I get taken out, that often indicates for me that the trend is potentially over. Obviously, it has it's upsides and downsides.

To conclude everything, adding faster MA might be the solution to not miss the move of a big trend which happens to me often, but I just don't know how I'd trade them to be honest. Any clues?

As you see, I am not the most experienced trader and I am open for suggestions like your suggestion.
  • Post #25
  • Quote
  • Jun 22, 2018 9:25am Jun 22, 2018 9:25am
  •  limprobable
  • Joined Jan 2012 | Status: Member | 537 Posts
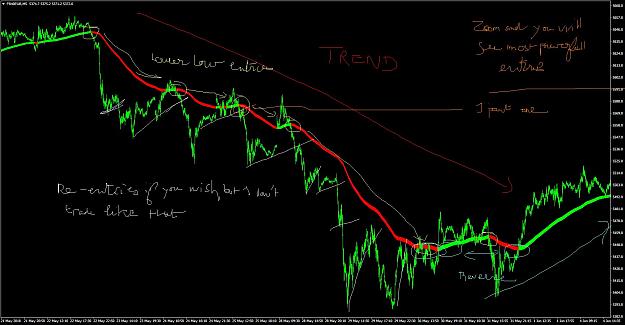
Attached Image (click to enlarge)
Click to Enlarge

Name: FR40EURM5.jpg
Size: 166 KB
Bottomless wonders spring from simple rules, which are repeated without end
2
  • Post #26
  • Quote
  • Jun 22, 2018 11:00am Jun 22, 2018 11:00am
  •  Sossos
  • Joined Apr 2013 | Status: Member | 681 Posts
The challenge in the use of a moving average is that the average is half the length of the number used. So if a 50 moving average is used, you are essentially 25 bars behind. That would be fine if you were trading the moving average, but we trade price.

Just as a primer to get you to start thinking, consider this. What if price was energy spent.

If what is claimed, that 90% of traders lose, then the 10% push each market with their buying and selling. It has to show up on the chart in the form of energy spent. Could it be where they take out the 90%ers stops?

If you want to use an indicator try putting an average true range on your chart and set it at one and as a bar chart. That will give each bar and you can easily find the 4 biggest bars of each day. Then study the 4 biggest bars of each day, going back 90 days. What happens after each of the biggest bars? What did each big bar take out, if anything? Was it an acceleration or did it falter and reverse? Was the ignition point of the big bar retested?

You then may see the market differently, maybe. Diligence and thoughtfulness in the process will lead you to more of your own questions. Answering your own questions will lead you to true knowledge. I'm just offering you the challenge of asking the first question.

If you don't want to do such a search, great. Just ignore my post. No harm, no foul.
  • Post #27
  • Quote
  • Jun 22, 2018 11:20am Jun 22, 2018 11:20am
  •  RaysJourney
  • | Joined Nov 2017 | Status: Member | 178 Posts
Quoting Sossos
Disliked
The challenge in the use of a moving average is that the average is half the length of the number used. So if a 50 moving average is used, you are essentially 25 bars behind. That would be fine if you were trading the moving average, but we trade price. Just as a primer to get you to start thinking, consider this. What if price was energy spent. If what is claimed, that 90% of traders lose, then the 10% push each market with their buying and selling. It has to show up on the chart in the form of energy spent. Could it be where they take out the...
Ignored
Stop hunt is something I am trying to teach myself - basically entering where other peoples stops are, which makes most sense (if that is what you are talking about). I was never a big fan of indicators but since I am still not a professional at reading price action and generally reading/understanding the market, I use indicators.

In this case, I will follow your advice and add the ATR on my chart, period 1, and see what I can come up with. It's better challenging me than being spoon fed (even if this thread appears to be one, I prefer receiving clues and finding the solution myself - so far it's been mainly that way). It doesn't sound like an easy task, but maybe I will find the clue you are trying to lead me to. Thank you for that, I hope I return with a positive research!
  • Post #28
  • Quote
  • Jun 22, 2018 5:21pm Jun 22, 2018 5:21pm
  •  daksgtrade
  • | Joined Dec 2014 | Status: Member | 18 Posts
Quoting limprobable
Disliked
{image}
Ignored
Hi limprobable. Is that a Heiken Ashi indicator in your post at a higher timeframe? What time frame that would represent assuming it is a Heiken Ashi indicator.

thanks
  • Post #29
  • Quote
  • Jun 25, 2018 4:24am Jun 25, 2018 4:24am
  •  limprobable
  • Joined Jan 2012 | Status: Member | 537 Posts
Quoting daksgtrade
Disliked
{quote} Hi limprobable. Is that a Heiken Ashi indicator in your post at a higher timeframe? What time frame that would represent assuming it is a Heiken Ashi indicator. thanks
Ignored
Hello Daksgtrade. This is a HA indicator on current time frame. You can have the same with a simple ema > 200 with color change.

green pips
Bottomless wonders spring from simple rules, which are repeated without end
1
  • Post #30
  • Quote
  • Nov 11, 2020 4:41pm Nov 11, 2020 4:41pm
  •  akfx
  • | Joined Oct 2011 | Status: Junior Member | 2 Posts
Quoting RaysJourney
Disliked
I've been trying to find threads regarding my question "How to buy/sell the dips in a trend?" in ForexFactory and other websites, but sadly with no success (at least I was not able to implement it correctly). If anyone has a link to a thread that explains exactly that, please link it, I'd appreciate it ...
Ignored
hi, so I'm arriving at this discussion perhaps a couple of years after the last post, but I'd like to resume the journey if I may, and ask the OP how things ended up going, after some of the helpful discussions above?

I'd have hoped that trend retracements should be one of the more robust strategies ("buying uptrend dips", converse for down) that should lend itself to being nicely implementable as an EA, or otherwise at least some kind of parameterized semi-manual strategy that can be verified via backtesting in some robust way, but so far I've not yet been able to design (or find) an EA implementation that actually works consistently enough, in any credible way.

So, if the OP [RaysJourney] would be willing to share any updates on how the backtesting and other results eventually turned out for this strategy, that would be appreciated!

thanks very much, in advance!
  • Post #31
  • Quote
  • Nov 12, 2020 12:41pm Nov 12, 2020 12:41pm
  •  tiborf71
  • Joined Apr 2011 | Status: Member | 1,983 Posts
Quoting RaysJourney
Disliked
I've been trying to find threads regarding my question "How to buy/sell the dips in a trend?" in ForexFactory and other websites, but sadly with no success (at least I was not able to implement it correctly). If anyone has a link to a thread that explains exactly that, please link it, I'd appreciate it. So, my question is: how do I buy or sell the pullbacks/retracements in a trend? I've been trading the trend for the past few months now, learning as much as I can and trying to implement everything what I have learned so far. So far, the most success...
Ignored
dude, you are completely wrong about how to perform trend trading.
  • Post #32
  • Quote
  • Nov 12, 2020 3:23pm Nov 12, 2020 3:23pm
  •  RickM
  • Joined Sep 2015 | Status: Member | 1,202 Posts
If Ray hasn’t worked it out by now, he must have realised that 95% of traders who buy dips in trends actually lose.
It’s a low probability setup with odds stacked against you due to trading costs.
Trading thin liquidity at the boundary of the charts
  • Post #33
  • Quote
  • Last Post: Nov 12, 2020 3:59pm Nov 12, 2020 3:59pm
  •  akfx
  • | Joined Oct 2011 | Status: Junior Member | 2 Posts
Quoting RickM
Disliked
If Ray hasn’t worked it out by now, he must have realised that 95% of traders who buy dips in trends actually lose. It’s a low probability setup with odds stacked against you due to trading costs.
Ignored
indeed, this is also what I infer from the failure of the various EAs that I've coded up and backtested, when trying to see if this could ever be successfully implemented.

So, while I was wondering whether my EAs were maybe just missing some aspect of this to make it profitable, it's probably the case that this strategy remains a failure (despite its promised hope) - if we receive no update from Ray then I guess we can conclude this and move on.
  • Trading Discussion
  • /
  • How to buy/sell the dips in a trend?
  • Reply to Thread
    • 1 Page 2
    • 1 Page 2
0 traders viewing now
Top of Page
  • Facebook
  • Twitter
About FF
  • Mission
  • Products
  • User Guide
  • Media Kit
  • Blog
  • Contact
FF Products
  • Forums
  • Trades
  • Calendar
  • News
  • Market
  • Brokers
  • Trade Explorer
FF Website
  • Homepage
  • Search
  • Members
  • Report a Bug
Follow FF
  • Facebook
  • Twitter

FF Sister Sites:

  • Metals Mine
  • Energy EXCH
  • Crypto Craft

Forex Factory® is a brand of Fair Economy, Inc.

Terms of Service / ©2021